Winnipeg has been enjoy a wonderful winter, quite a surprise given that a lot of forecasts had called for colder than normal temperatures, a common occurance when La Nina is in full swing. This winter has been stellar so far, but just how warm has it been? Lets take a closer look, and then a special announcement!
For full disclosure, I’m using numbers from January 1981 to now from the Winnipeg Richardson Int’l Airport (1981-2007) and the Winnipeg Richardson AWOS (2007-Current). The numbers are gathered from the daily summary provided on the Weather Office Climate Archive site. The data used is “current” to January 25, 2012.
Looking first at daytime highs. We know that December was well above normal, as was the start to January. How much above normal?
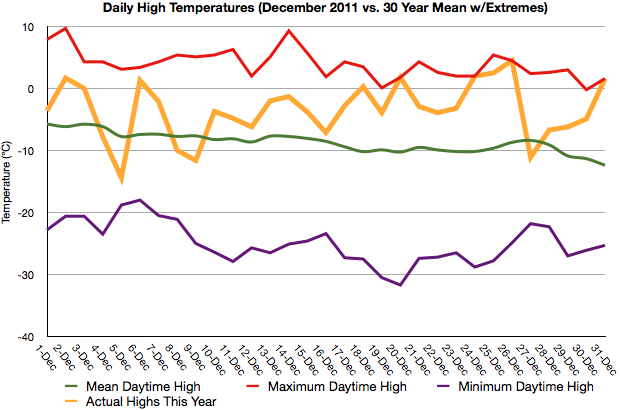
We can see that this year (yellow bold line), much of December was spent above our average daytime high. In fact, 84% of the days in December had daytime highs above normal, with a streak of 17 days with above normal temperatures. We were, on the days we were above normal, on average 10°C above our normal daytime highs for each respective day in December.
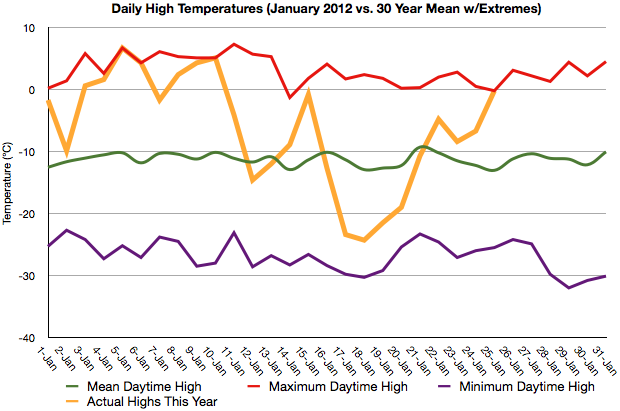
So far this January, we’ve been off to a great start as well, with 71% of our days above normal for daytime highs, which isn’t bad for having quite a cold snap in the middle of the month. We had a nice streak at the beginning of the month with 11 days in a row with above normal temperatures. On the days this month that we’ve been above our normal temperatures, we’ve been, on average, 6.5°C above normal for each respective day in January.
So the days have been warm. This only tells half the story, however. An interesting story emerges when we look at overnight lows…
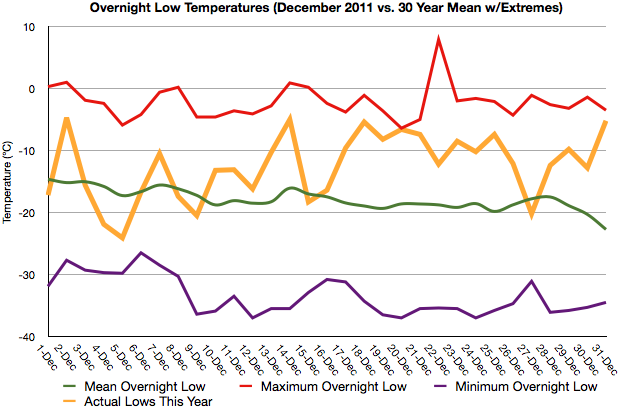
When we look at December of this winter, we see a compelling argument unfold. 23 nights (74%) of the monthhad temperatures, on average, 8.4°C above normal. We had 11 nights in a row with overnight lows above normal by as much as 13.5°C! And January is an equally compelling story…
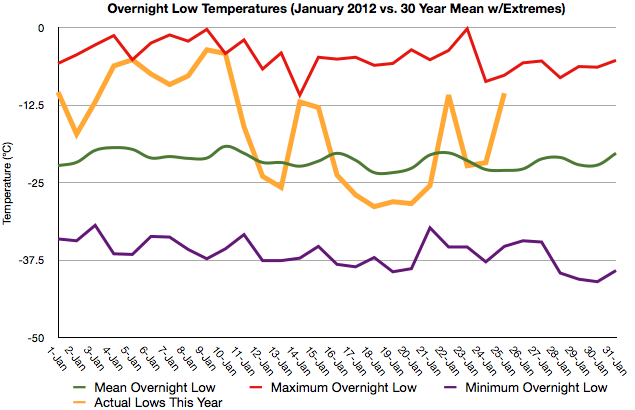
This month, we’ve spent 16 nights with above normal temperatures (65% of the month), which have been 10.6°C above normal on average. We had a wondeful streak of 11 nights at the beginning of the month with above normal overnight lows, including January 9th, whose overnight low was a whopping 17.5°C above the 30-year mean.
So not only have we been nowhere close to as cold as it can be, we haven’t even really spent any signifigant time being anywhere near as cold as we ought to be! But there’s one way to make this even more succinct…
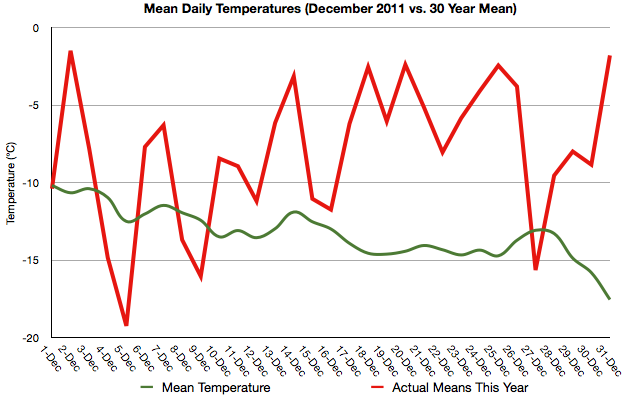
What I’ve done here is a crude approximation of the mean daily temperature. While it would be nice to properly integrate the hourly observations to calculate a true time-weighted mean temperature for each day, I have weather stripping to install, shelves to build, and many other things that would also like my time. So I’ve done a quick average of each day’s maximum and minimum temperatures ( [Max + Min]/2 ). I’ve calculated the 30 year mean by taking the mean of the mean daily temperatures.
What this shows us is a “combined” look at how much warmer the entire day was, instead of singular values. We can see that once we shifted into a warmer patter around the 10th of December, we cruised without looking back. A total of 26 days (84% of the month) above the normal mean daily temperature, with many days as high as 10-15°C above normal. We had 17 days in a row with above normal temperatures in December, and for all the days above normal, we were on average 6.9°C warmer.
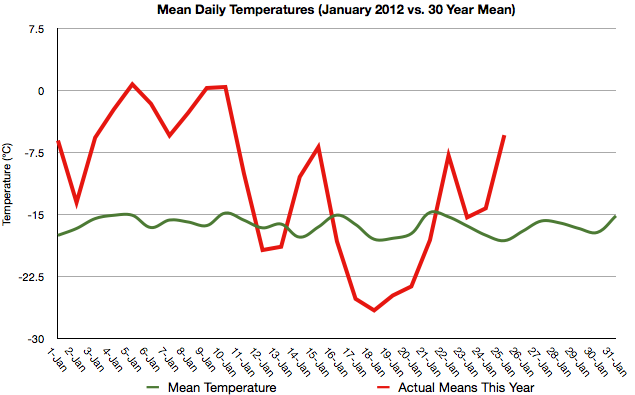
January tells a similar story with 17 days so far above normal, on average by 10°C! What these mean values tell us is that not only have our days been warm this winter, but the entire 24-hour cycle has been significantly wamer than normal as well. Save for one day, we were above normal in hour temperatures from December 10th to January 11th, 32 days in a row. We spent a month with temperatures 6-10°C above normal on average, with many days near or warmer than 0°C during a time of the year when it’s not uncommon to be hiding inside while it’s -35°C outside! What a winter indeed!
And with ensembles predicting above normal temperatures into the middle of February, our odds of getting an entrenched arctic deep freeze in Winnipeg are starting to look mighty, mighty slim. Something I’m sure not too many people will complain about.
And Now For Something Different…
So, what if you want to make your own temperature forecast? Or precipitation forecast? What if you need to make your own decision on whether or not you should take your sailboat out on the South Basin tomorrow?
Fortunately for the public, most government agencies make their model data freely available for use. Getting at it can be difficult and time-consuming though. Everybody has their own tools for viewing data; often they are bulky and slow server-side PHP solutions. That jargon means that it’s not very fast and you spend a lot of time waiting for pages to reload.
Well, it doesn’t have to be that way! A Weather Moment is excited to introduce our model viewer! We’ve built a comprehensive tool that lets you view model data from several models, including Environment Canada’s GEM-Regional and GEM-Global models, the NWS NAM and GFS models, as well as the UKMET model and ECMWF. Over time, we plan on adding more publically accessible data to the viewer.
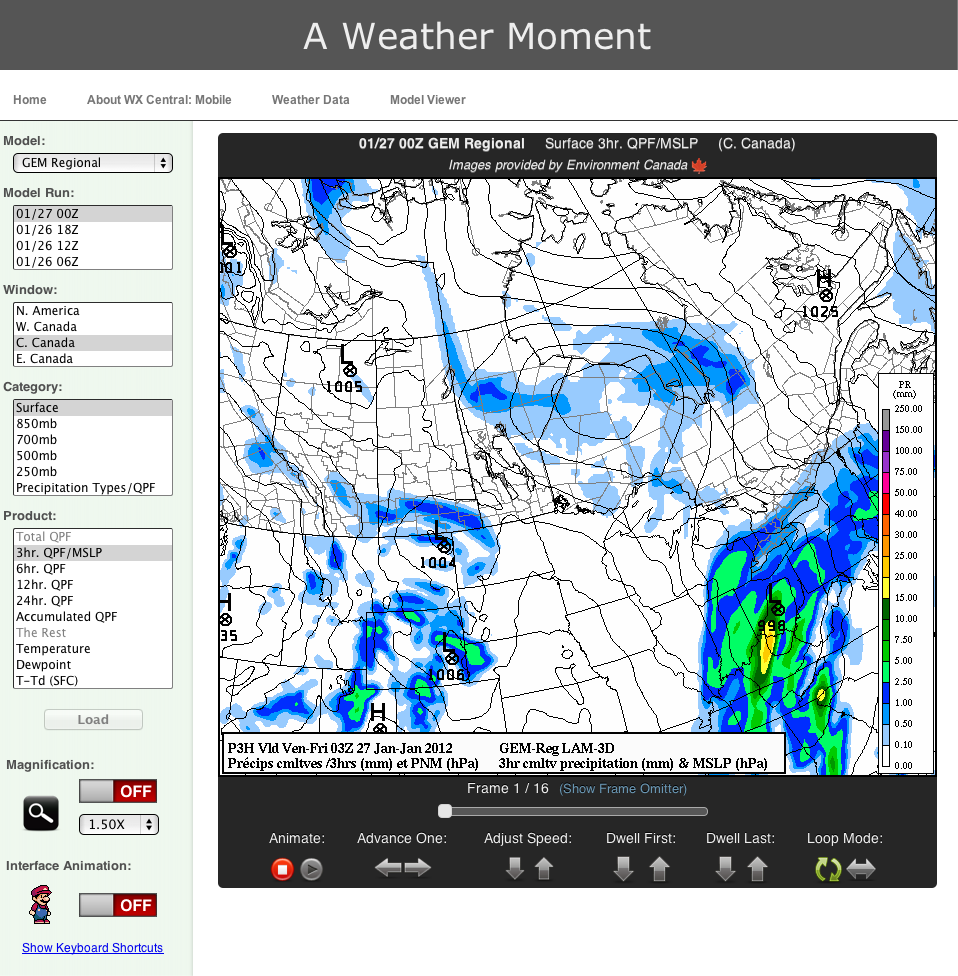
You can easily switch models and load new products without ever having to refresh the page. We have convenient keyboard shortcuts to control everything from animation to mangification to removing frames from the loop or jumping back to the beginning or end. Our Frame Omitter gives you the control to view exactly the images you want. All of this is part of a lightning-fast backbone that lets you view model data quicker than anywhere else on the internet.
We are providing this to let you begin to see what goes into making a forecast. Please note that model data is not the “answer” to the weather. It is a computer’s opinion, and is wrong just as often as anyone else is. It can be very helpful guidance, and can often give you a good idea of what to expect.
We hope that this tool can help anybody who views our site access weather forecasting information quickly and easily! The only limitation is that, unfortunately, the viewer does not currently support Internet Explorer. There are a lot of technical reasons for this, but ultimately it’s because I’ve coded the tool to W3C standards for optimal compatibility, and Internet Explorer does not yet conform to those standards. The tool may or may not render and/or operate correctly on any version of Internet Explorer. Any other browser will work great, though (e.g. Mozilla Firefox, Google Chrome, Apple’s Safari). You can check it out by hitting the Model Viewer link at the top menu of the site, so go check it out!