Editor’s Note: Something I’ve wanted to do far more frequently than I’ve been able to is comprehensive climate statistics for Winnipeg. In between the regular posts, occasional event summaries and keeping this website humming along, I simply haven’t had the time time to get my personal climate archive quite up to snuff yet to really dig into things. So, I’d like to introduce a new contributor to the AWM team, Julien (@jjcwpg on Twitter). He’s the proprietor of Winnipeg Weather, does fantastic work with climate statistics[1] and will be in charge of seasonal climate updates as well as summer severe weather climatologies, similar to his guest post covering last summer’s thunderstorm statistics across the province. Since Julien is joining the team mid-season, we’re doing a “Year so Far” climate summary to bring readers up to speed on the current climate story for Winnipeg – hint: it’s cold – and to introduce him. So without further ado, here’s the first post of our new feature: State of the Climate!
Quite the year so far!
It’s no secret that 2014 has been an unusually cold year so far; in fact, we’ve managed to reach some impressive milestones in the last few months. Our brutal winter is now long gone and most of you probably want to forget about it (me as well), but before doing so I do have some interesting statistics about the winter of 2013/14 that I think are worth sharing.
To start off, this past December to March period didn’t only feel like one of the harshest ever recorded in Winnipeg, it statistically was. Our mean temperature (an average of all daily highs and lows) was -18.4°C, making it the coldest December to March period in 115 years. However, because we only tied with the winter of 1898-1899 for 11th coldest, we have to go back 121 years to find a December to March period that was even colder than this year’s. With 124.6cm of snowfall, it was also the 12th snowiest December to March period. Combining 12th snowiest with 11th coldest truly made this past winter one of the harshest since records began in Winnipeg in 1872.
In total, there were 90 days below -20°C between December and March, tying 6th most since 1872 and the most in 121 years! That’s 74% of all available days! The 1981-2010 normal is 51 days. The following table summarizes the number of -20°C and -30°C days we had from December to March.
| Month | Days below -20°C | Days below -30°C |
|---|---|---|
| December | 25 (tied 6th most) | 9 (tied 15th most) |
| January | 26 | 12 |
| February | 24 (tied 13th most) | 6 |
| March | 15 (tied 20th most) | 2 |
| Total | 90 (tied 6th most) | 29 (tied 19th most) |
The winter minimum was -38.0°C on January 5, the coldest temperature in Winnipeg since a -41.7°C low in February 2007. The high of -30.2°C for the day was not only a record low maximum but also the coldest since a -30.8°C high on Jan 30, 2004.
Many of you might remember the super cold day we had on March 1. Well, I’d say that was the most anomalous day of the winter. The low of -37.0°C that day was actually the 9th coldest in March since 1872. The high of -26.0°C obliterated the old record low maximum of -22.2°C in 1972 and was the second coldest in March on record. The mean temperature for the day was -31.5°C, making it the second coldest March day since 1872. In fact, this was a whopping 21°C below normal for the day, almost as extreme as March 2012’s 23.7°C above normal on March 19, 2012. Of course, to Old Man Winter all this was not enough. A minimum hourly wind chill value of -49.6 at 7 am was the lowest ever in March since 1953. Previous record was -48.8 in 1962.
Cold Not the Only Story of 2014
Despite all the cold weather news to talk about this year, one warm record managed to stand out. On January 15, a high of 3.3°C broke the old record high of 2.2°C in 1973. However, this high was an amazing 30.7°C increase from a low of -27.4°C in the morning, the greatest single-day warmup on record since 1872[2]. The top 5 are given in the table below. The 30.7°C warmup took about 14 hours and peaked between 4 and 5 pm when the temperature rose 5-6°C in just 1 hour.
| Rank | Temperature rise of… | Date |
|---|---|---|
| 1 | 30.7°C | Jan 15, 2014 |
| 2 | 30.6°C | Jan 20, 1874 |
| 2 | 30.6°C | May 12, 1949 |
| 4 | 30.5°C | May 19, 1899 |
| 4 | 30.5°C | Jan 30, 1934 |
Nonetheless, the cold will forever be remembered as the top story of early 2014.
Stubborn cold continues into spring
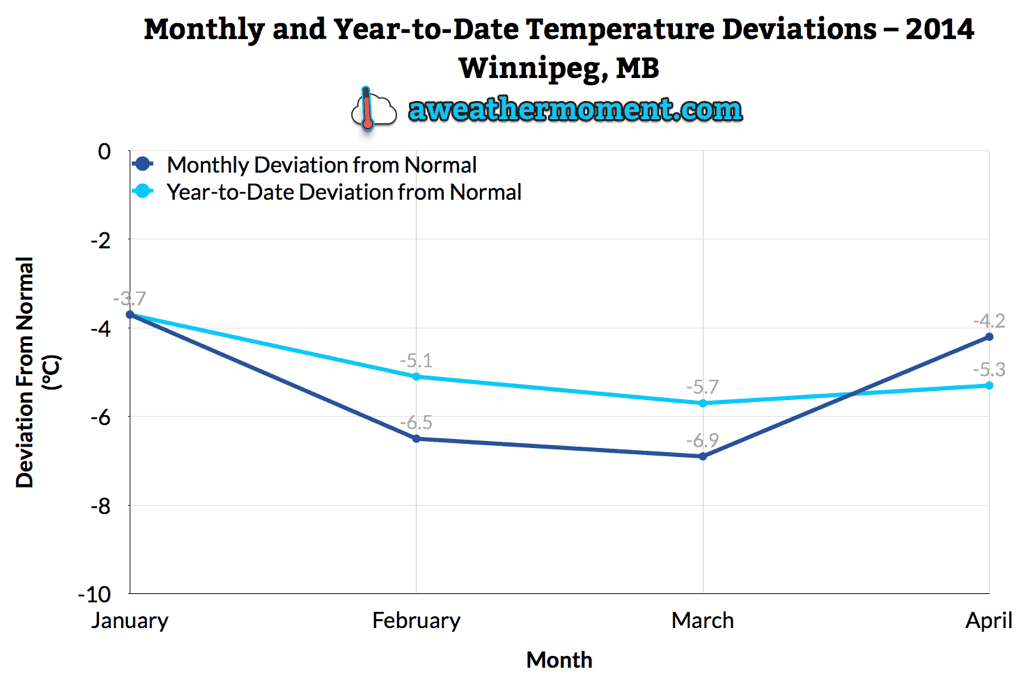
In more recent memory, the cold continued into April with near record lows at times mid month. At 4.2°C below normal, April was the 5th consecutive month averaging over 3.5°C below normal and 7th consecutive month averaging below normal in general; a streak which began in October. In fact, up to April 30 we’ve averaged -13.1°C for 2014, 5.3°C below normal for the period. This ties with 1996 for 15th coldest first third of the year since 1873 and 4th coldest in the last century. The following graph shows how each month so far this year has averaged compared to the 1981-2010 normal as well as the year-to-date average compared to normal.

Yet another couple impressive statistics have come from this year’s cold. Our winter snow pack still sat at 43cm deep on April 1, the 3rd deepest winter snow pack entering into April since 1955. It didn’t reach a trace cm until April 19, the 3rd latest on record, and disappear until April 21, the 8th latest on record.
Thank you for reading and we hope you all enjoyed this first State of the Climate post!
