State of the Climate: A Look at 2015

Welcome to A Weather Moment’s look back at the weather in Winnipeg for 2015. In this update, we’re going to take a look at how temperature & precipitation developed through the year and how 2015 stacked up against the history books. In another post coming soon, we’ll take a look at the top 10 weather events of 2015!

2015 Stats & Rankings for Winnipeg
Category 2015 Average or Total Rank (since 1873)
High Temperature 10.1°C 7th warmest (tie)
Mean Temperature 4.2°C 9th warmest
Low Temperature -1.7°C 11th warmest (tie)
Rainfall 450.9 mm 38th rainiest
Snowfall 116.7 cm 64th least snowy
Precipitation 529.6 mm 61st wettest

Temperature: Chilly Start With A Mild Finish

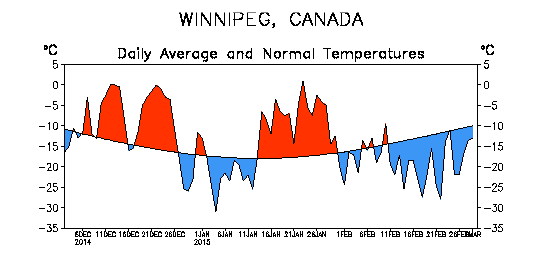
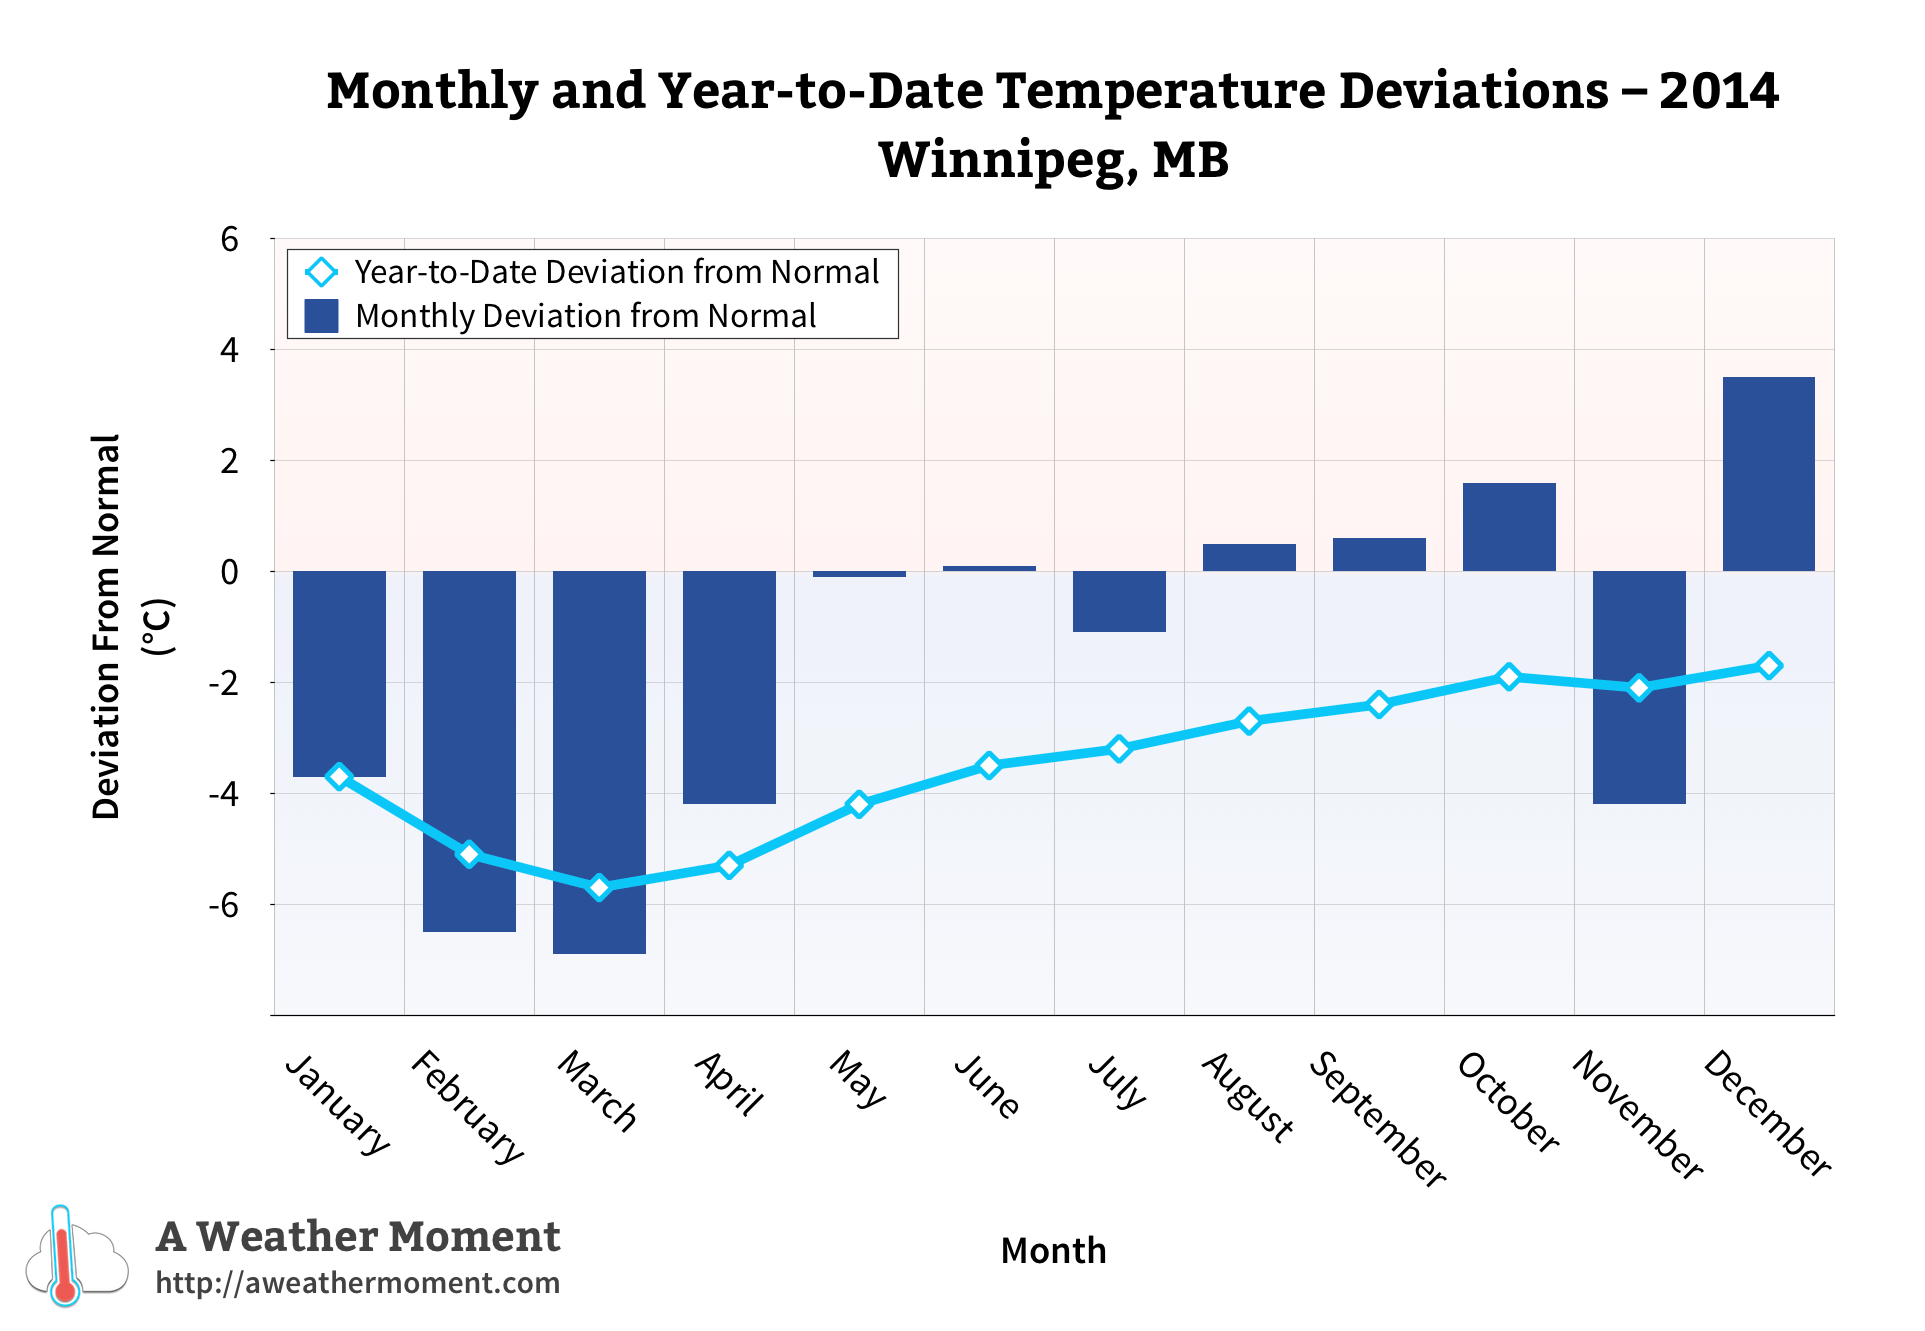
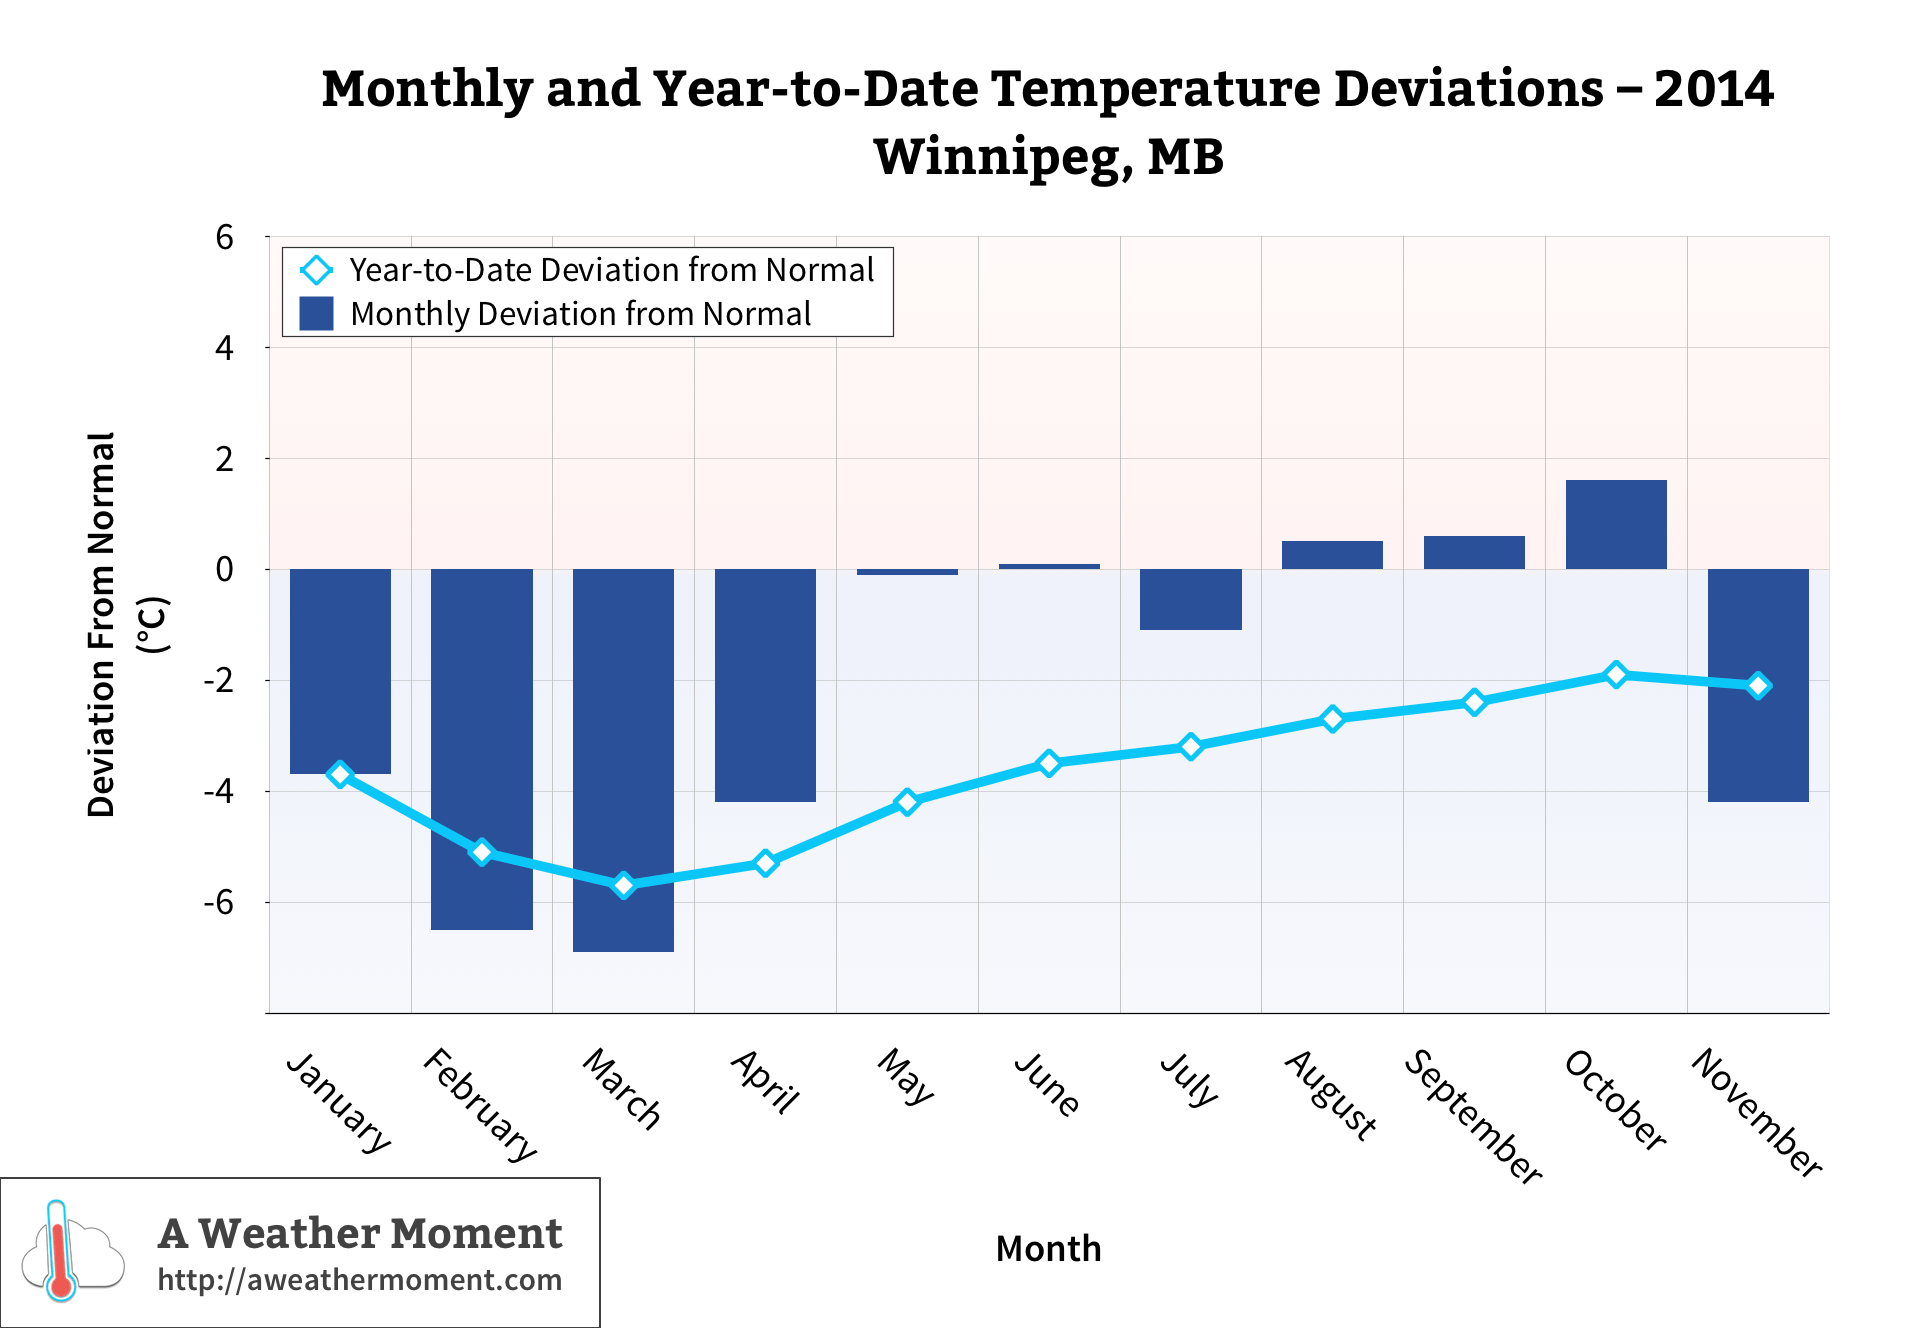
With a mean temperature of 4.2°C at the Winnipeg International Airpot, 2015 was the 9th warmest year on record since 1873 in Winnipeg and the warmest since 2012. This was 1.3°C warmer than the 1981-2010 normal of 2.9°C. In addition, daily high temperatures averaged 10.1°C, only the 9th time since 1873 that this value was in the double digits. The graph below shows how each month fared compared to normal and how the year-to-date average changed throughout the year.

Only three months were colder than the 1981-2010 normals: February (-5.7°C), May (-0.4°C) and August (-0.2°C). February was by far the most abnormally cold month, averaging -19.2°C, 5.7°C below normal and the 27th coldest February since 1873. It was also the 3rd coldest February since 1980 and the 11th coldest February in the last century. Only 6 days rose above -10°C, tied 10th least since 1873. Interestingly, it was the 10th colder than normal February in the last 11 years.

Six months in 2015 averaged over 2°C above normal: December (+5.4°C), November (+3.7°C), September (+2.9°C), March (+2.8°C), January (+2.7°C) and October (+2.0°C). There was a streak of four months averaging over 2°C at the end of the year. In fact, the September to December period was the third warmest on record since 1872 with an average of 3.5°C. Only 1931 (avg 4.1°C) and 1923 (avg 3.7°C) were warmer. The 1981-2010 normal is 0.0°C.

Top 10 Warmest Years in Winnipeg (Since 1873)
Rank Average Mean Temperature Year
1 5.4°C 1987
2 5.3°C 1931
3 4.7°C 1878 & 1998
5 4.6°C 2012
6 4.5°C 2006
7 4.4°C 1981
8 4.3°C 1999
9 4.2°C 2015
10 4.1°C 2010

Other stats included:

  • 12 days above 30°C at the airport (normal is 14 days) and 16 days at The Forks
  • 45 days below -20°C at the airport (normal is 53 days) and 33 days at The Forks
  • 3 new record highs (13.2°C on Mar 14, 24.8°C on Apr 15 and 5.6°C on Dec 9) and 3 new record high minimums (21.2°C on Aug 15, 21.0°C on Sep 3 and 5.3°C on Nov 16)
  • NO new record lows or low maximums in 2015

Precipitation: Highly Variable & Above Normal

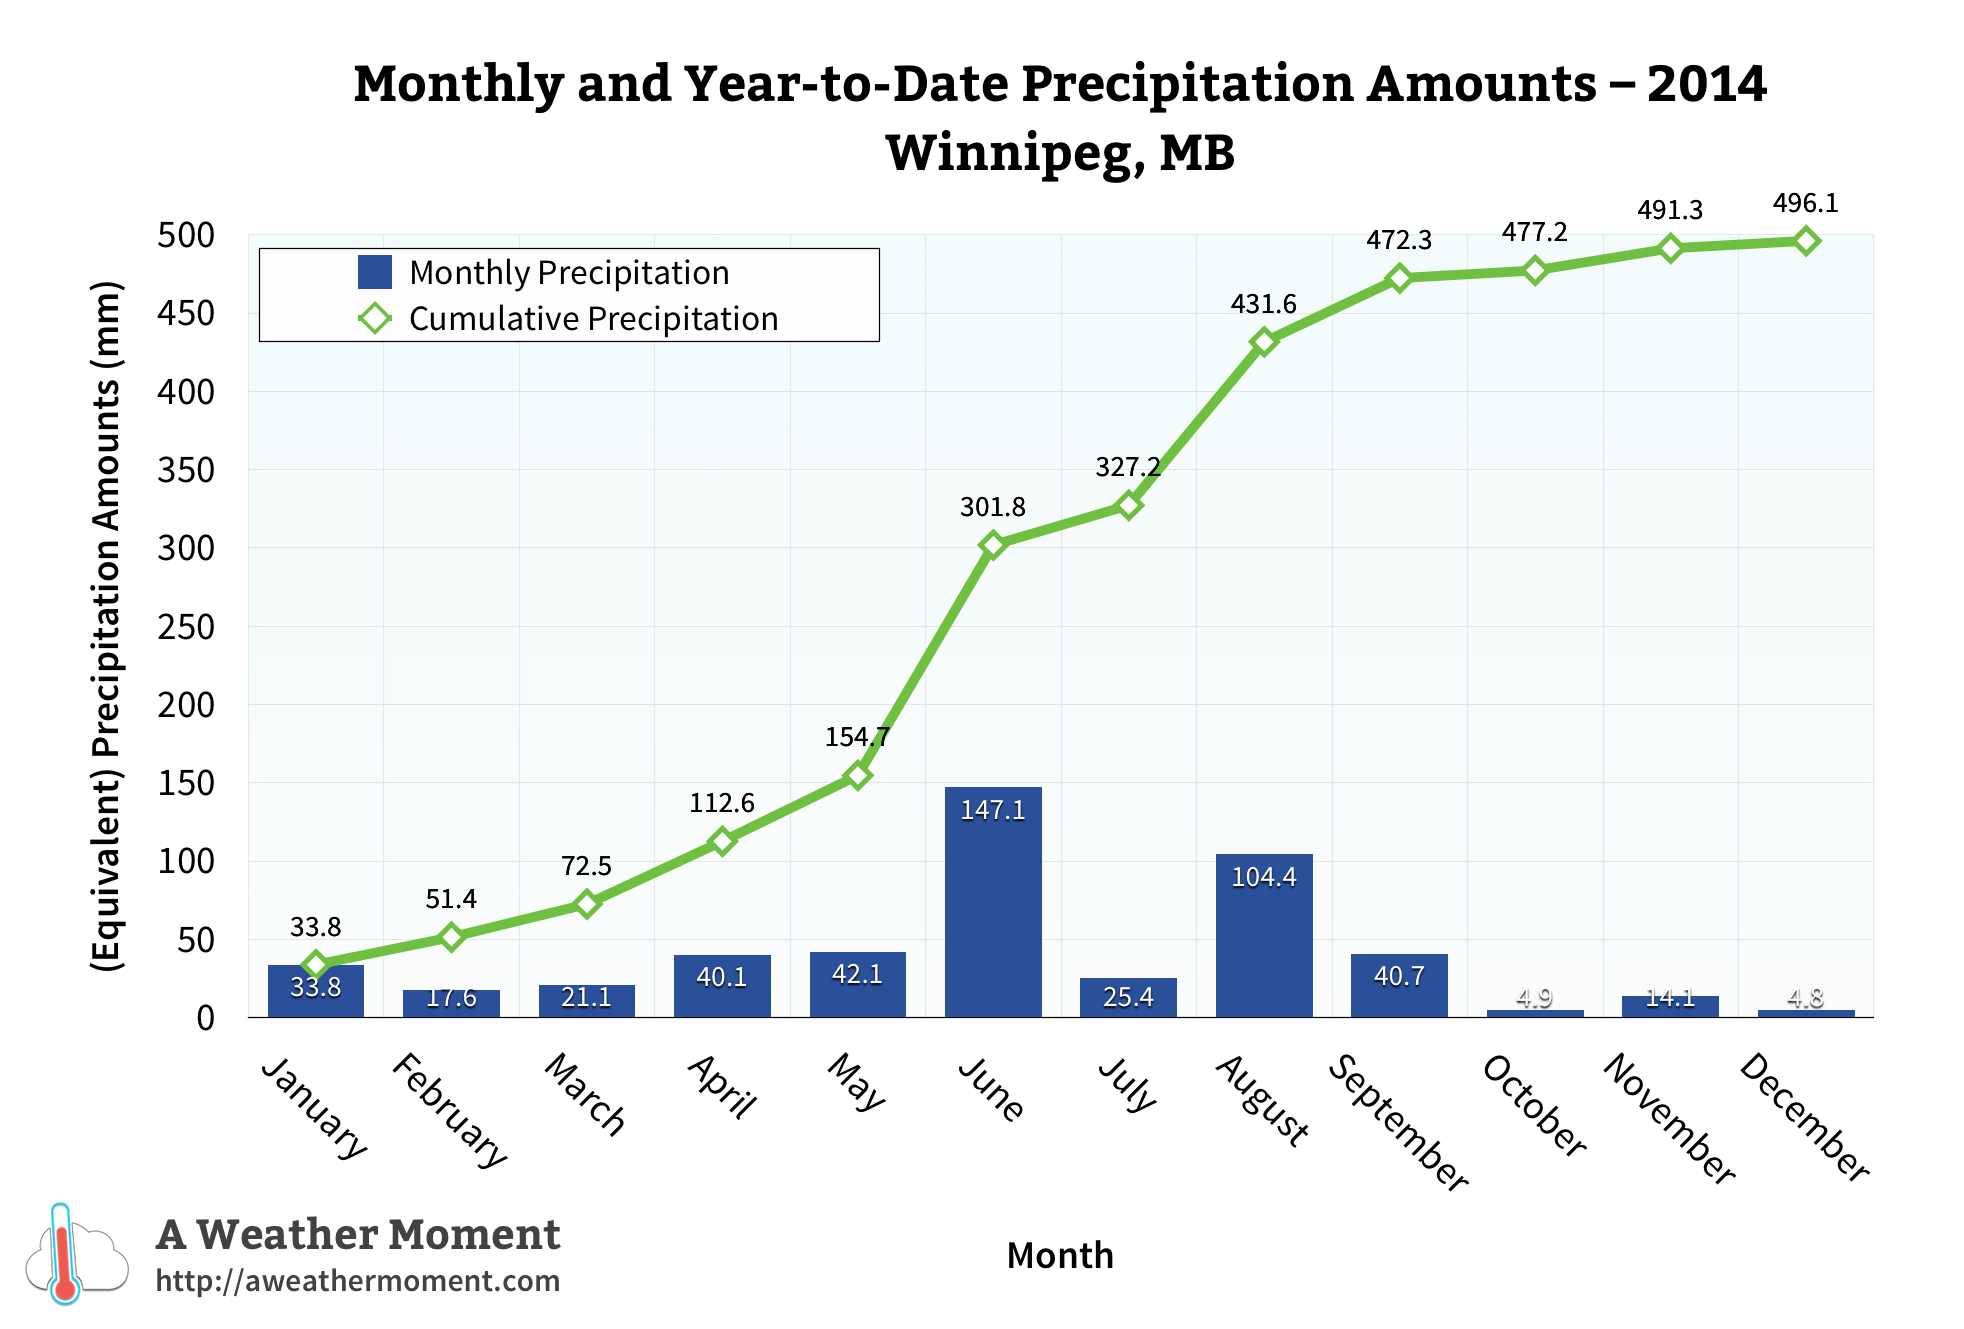
2015 was a wet year in the Red River Valley. In Winnipeg, 450.9 mm of rain fell at the airport, about 23 mm above normal. This was on the low end of things because many stations inside the city received over 500 mm. 544.0 mm of rain fell in south St. Vital, the rainiest year since 2010. August was the rainiest month with 148.8 mm in Charleswood, 140.5 mm in south St. Vital and 107.8 mm at the airport. The rainiest day of the year in the south end was August 22 with 68.8 mm in Charleswood and 54.5 mm in south St. Vital. September 4 was the airport’s rainiest day with 41.1 mm. These rainy days were the consequence of heavy thunderstorms.

In terms of snowfall, generally 115 to 120 cm or so fell in Winnipeg. This is basically bang on normal. More than a third of this snow fell in December with 44.0 cm, the 12th snowiest December on record since 1872. In fact, about 40 cm fell in just 8 days from December 16 to 23.

Combining rainfall with melted snowfall gives a total precipitation amount for the year. About 530 mm fell in Winnipeg officially, which is within a few mm of normal (note that I use The Forks station in the winter months and the airport station in the warmer months because the airport station underestimates winter precipitation). Again, most parts of the Red River Valley saw much more. 632.3 mm of precipitation fell in south St. Vital, about 80 mm more than in 2014 and the most since 2010. Widespread totals over 600 mm occurred south and southeast of the city. Locally over 700 mm was recorded at some CoCoRaHS stations in the Steinbach area. The higher totals were seen in areas that were hardest hit by heavy thunderstorms over the summer.

Other stats included:

  • 3 new record high rainfalls (31.3 mm on May 17, 38.4 mm on Aug 22 and 41.1mm on Sep 4)
  • 1 new record high snowfall (18.0 cm on Dec 16)

Wrapping Up 2015

Overall, it was a very warm and wet year in the Red River Valley.

The 30-year normal temperature in Winnipeg now stands at 3.0°C (1986-2015 period), tied with the 1984-2013 period for warmest 30-year period since 1872. This means we are currently the warmest we have been in at least 140 years.

It was also an active year for thunderstorms across southern Manitoba with numerous severe hail and tornado events. Stay tuned over the next couple weeks for the top 10 events and stories of the year which will summarize the biggest extremes we saw in 2015.

State of the Climate: Meteorological Winter 2014-15

Daily temperature anomalies this winter (source)

This winter has been much easier to handle compared to last year. Despite frigid conditions returning in February, meteorological winter 2014-2015 still averaged close to normal thanks to warm conditions in December and January. The 3-month period averaged -14.3°C, just 0.2°C above normal. This is 6.0°C warmer than last winter!

Meteorological winter rankings for Winnipeg
Category Winter 2014-15 Total/Avg. Rank (Since 1872–73)
High Temp. –9.5°C Tied 42nd Warmest
Mean Temp. –14.3°C Tied 33rd Warmest
Low Temp. –19.0°C Tied 35th Warmest
Rainfall 1.2 mm (est.) 48th Rainiest
Snowfall ~ 43 cm 28th Least
Precipitation ~ 31 mm 9th Driest

Mild & Lack of Snow in December and January

December was the warmest month of the winter, averaging -10.0°C. This was 3.5°C above normal and a whopping 10.9°C warmer than in 2013. Many people would probably remember December for its gloominess however. Several consecutive days of cloud, fog and freezing drizzle occurred. In fact, freezing drizzle fell on 7 days. The cloud kept our daytime highs cooler than they could have been, but helped keep us warm at night. In fact, 3 daily high minimum records were broken. Most notable was a low of -0.5°C on December 12 which broke the old record of -3.9°C back in 1877, Winnipeg’s warmest December on record. Sunshine made more of an appearance in southwestern Manitoba where highs well above zero occurred. Even a few double digit highs were recorded close to the US border. For instance, Deloraine reached 10.3°C on December 11.

There was also a lack of snow in December. Just 7.2 cm fell in Winnipeg, the 16th least snowiest December since 1872. In addition, snow depth never rose above 10 cm. Some areas close the US border even experienced a brown Christmas. The photo below is from Emerson on Christmas Eve morning.

Emerson on Christmas Eve morning

After a cold snap to start 2015, the warmth returned mid January. Temperatures exceeded the freezing mark, nights were unusually mild and what little snow there was on the ground was melting. In the end, January finished 2.7°C above normal, tying with 2010 for 19th warmest. Thanks to melting, snow depth was just 12 cm at the end of the month, the 12th thinnest snow pack at the end of January since 1941.

In total, 11 days in December and January exceeded the freezing mark in Winnipeg, above the normal of 7 days.

February Cold Snap

Winter made its presence well known in February. The month was awfully reminiscent of last year with seemingly endless colder than normal conditions. The month averaged -19.2°C, 5.7°C below normal and the 27th coldest February since 1873. 21 days dipped below -20°C, above the normal of 14 days. The monthly high was a measly -3.1°C. In fact, only 6 days rose above -10°C, tied 10th least since 1873. This February was the 10th colder than normal February in the last 11 years. Since 2005, only 2012 had a warmer than normal February.

Lack of Snow This Winter

Approximately 43 cm of snow fell from December to February (exact amount to be confirmed), about 19 cm below normal. Even more unusual, only approximately 31 mm of precipitation fell making it the 9th driest meteorological winter since the winter of 1872/1873. Now in March, snow depth only sits around 20 cm in Winnipeg.

A Look Back at 2014

I will end this post with a quick look back at the cold year that was 2014. The year averaged 1.2°C, 1.7°C below normal. In fact, it was the coldest year since 1996. Although it was only tied 28th coldest since 1873, it was the 9th coldest in the last century. This was in large part thanks to the very cold winter and spring we experienced.

Monthly & year-to-date temperature deviations for 2014 in Winnipeg, MB

As for precipitation, 2014 was slightly drier than normal in some parts of the city and wetter than normal in others. Approximately just less than 500 mm of rain fell officially at the airport, slightly below the normal of 527 mm. It was wetter in southern and southwestern parts of the city where heavy thunderstorms dumped locally flooding rains in the summer. Well over 400 mm of rain fell in these locations. At my place in South St. Vital I recorded 450.0 mm of rain and 550.6 mm of precipitation.

Monthly & year-to-date precipitation amounts for 2014 in Winnipeg, MB
Monthly & year-to-date precipitation amounts for 2014 in Winnipeg, MB. Data combined from the James Richardson International Airport and The Forks.
Overall, snowfall was close to normal with 118.4 cm (normal is 117.3 cm). Nearly 80% of this fell from January to April. As mentioned already, there was a notable lack of snow in December.


Note: Unless otherwise noted, all normals stated in this post are the 1981-2010 normals. I use the normals that I have calculated which you can see anytime by following this link.

Southern Manitoba 2014 Thunderstorm Statistics

This photo of a funnel cloud was taken just southwest of Winnipeg.

Welcome to our summary of the 2014 thunderstorm season across Southern Manitoba! This post will summarize these statistics and compare this year’s thunderstorm season to the last couple seasons. In case you are curious, a brief explanation of how I gathered these statistics can be obtained by following this link.

Thunderstorm Days

The number of days with thunderstorms across southern Manitoba broken down into 6 regions. Includes the date of first thunderstorms and last thunderstorms.

In total, there were 94 thunderstorm days across southern Manitoba in 2014 (southern Manitoba being defined as the area shaded in the map above). This was slightly higher than in 2013 (89 thunderstorm days) but still much lower than in 2012 (~ 109 thunderstorm days). This is mainly the result of a late spring and thus, a late start to the season in both 2013 and 2014. 2012 featured an early spring with numerous thunderstorm events in March and April. This year, no thunderstorms occurred in March and only 2 thunderstorm days occurred in April. In fact, southeastern, eastern and Interlake portions of southern Manitoba did not see their first thunderstorm until the third or fourth week of May, at least a month later than usual. Winnipeg didn’t get its first thunderstorm until May 20, the 8th latest first thunderstorm on record since 1953.

The distribution of thunderstorm days, as seen in the map above, was fairly uniform across southern Manitoba overall. Similarly to 2012 and 2013, the region east of Lake Winnipeg saw notably less thunderstorm activity.

Interestingly, there was a thundersnow event in January! Although lightning detection products did not record the lightning, lightning was reported by residents west and southwest of Winnipeg on the evening of January 15; more specifically between Carman and Winkler. This was associated with a very strong cold front behind a potent Alberta Clipper. This clipper also brought record winds and high temperatures across the Prairies. Unfortunately, I could not find any data on winter thunderstorm activity in Manitoba historically. The only other occurrence of lightning in January I could find was a report in the Daily Free Press of lightning on January 16, 1876 (Penziwol, 2004). This is not to say that lightning has never occurred in January since then, but that is the only other report I could find. Nonetheless, this year’s thundersnow event was extremely rare for Manitoba.

In Winnipeg, 23 thunderstorm days occurred at the airport in 2014. Although this is the most since 2010, it is still below the normal of ~26–27 thunderstorm days. In fact, we have not had an above normal season since 2007. The last thunderstorm recorded was on September 8, tying for 10th earliest last thunderstorm since 1953. This puts the season at 112 days long, the 5th shortest on record. However, this statistic is a bit misleading. Thunderstorms did occur in southern parts of the city 3 times after September 8, including 2 events in October. I recorded 27 thunderstorm days here in South St Vital this year and the season lasted 156 days.

Severe Thunderstorm Warning Days

The number of days in which severe thunderstorm warnings were issued through 2014 in Manitoba, broken down by forecast region.

In total, there were 34 days with a severe thunderstorm warning issued in southern Manitoba. This is similar to 2012 but much less than in 2013 (45 severe thunderstorm warning days). The first warning was issued on May 24 and the last on September 8, putting the season at 108 days long. This is a tad less than in 2013 (110 days long) and 2012. As has been the case the last few years, southwestern Manitoba saw the most severe thunderstorm warning days in 2014.

Tornadoes

The number of days tornado warnings were issued across Manitoba in 2014, broken down by forecast region.

There were 4 tornado warning days in 2014, half the number in 2013 (8 days) but double the number in 2012 (2 days). The Red River Valley area saw the most. In fact, the warning zone southeast of Winnipeg, which Steinbach is situated in, saw 3 tornado warning days, the highest of all warning zones in Canada this year. However, only one of these warnings actually produced a confirmed tornado (an EF–0 southeast of La Salle on July 26).

From what I could find, 4 EF–0 tornadoes were confirmed in Manitoba this year. However, it is likely that there were more (many go unconfirmed). July 26 was the biggest tornado day of the year with 3 landspout tornadoes confirmed (all EF–0). 2 were in the Interlake near Waterhen and the other was southeast of La Salle.

A tornado might have touched down (unconfirmed) southwest of Winnipeg July 5. Part of the A Weather Moment team (Scott, Matt, Julien & Kyle) watched the storm as it evolved and managed to capture at least 2 funnel clouds. One of these is seen in Matt’s funnel cloud picture at the top of this post. After reporting this funnel to Environment Canada, a tornado warning was issued for the City of Winnipeg.

Monthly Frequency

Thunderstorm-related days per month (thunderstorms, severe thunderstorms and tornadoes) for Southern Manitoba in 2014.

For the first time since I started gathering these statistics in 2010, the busiest month of the year for thunderstorm activity across southern Manitoba was in June. The maximum is typically in July, but this year there was an unusual local minimum in activity in July with just 18 thunderstorm days. Residents in southwestern Manitoba were especially hard hit in June with multiple rounds of heavy thunderstorms and rains mid-late month. Over 150 mm of rain fell in the heaviest hit areas in just a period of 2 weeks. 251.6 mm of rain fell in June in Brandon, the rainiest June on record since 1890. 219.8mm of this fell in just the last 12 days of the month. Extensive overland and river flooding occurred as a result, as many of you likely still remember well.

If interested in comparing, follow these links for the 2013 and 2012 graphs: 2013, 2012.

Reference Cited
  1. Penziwol, Shelley. (2004). Storm Signals: A History of Weather In Manitoba. Great Plains Publications. Winnipeg, Manitoba. Page 3.

State of The Climate – Meteorological Fall 2014

Wow, what a fall temperature-wise in southern Manitoba this year! From record July-like heat in late September to January-like cold in November, we saw the extremes of all seasons… Here are the average temperature and total precipitation rankings for fall 2014 in Winnipeg:

Meteorological Fall Rankings for Winnipeg
Category Fall 2014
Average/Total
Rank
High Temp. 9.1°C Tied 49th coldest
Mean Temp. 3.8°C Tied 48th coldest
Low Temp. -1.5°C Tied 53rd coldest
Rainfall 47.3 mm 24th least
Snowfall 18.2 cm Tied 46th least
Precipitation 59.7 mm (est.) 18th driest

The meteorological fall (Sep-Oct-Nov) averaged 3.8°C or 0.7°C below the 1981-2010 normal. The negative anomaly was due to a frigid second half of November. September and October actually averaged warmer than normal with anomalies of +0.6°C and +1.6°C respectively. November on the other hand finished 4.2°C colder than normal with an average of -8.8°C, the 22nd coldest November on record since 1872 and the coldest since 1996.

Record Heat & Humidity In Late September

The dramatic burst of July-like heat we had in late September was perhaps the top weather event of fall 2014. The bulk of the warmth occurred September 22 to 27 with 6 of those days seeing highs over 25°C, a good 10-15°C above normal for that time of year. Overnight lows remained well into the teens.

Fall colours as seen in Henteleff Park on September 13, 2014.

September 26 was the hottest day with a high of 30.2°C at Winnipeg Airport, just shy of the old record of 31.7°C in 1952. However, it was even hotter in southwestern Manitoba where the heat was literally unprecedented for so late in the season (at least since records began). In Brandon, highs of 34.0°C and 32.8°C on the 25th and 26th respectively were the hottest on record for so late in the season since 1890. The provincial hotspots during the hot spell were Swan River and Wawanesa with maximums of 35.1°C!

In Winnipeg, only 1 temperature record was broken; a record high minimum of 17.4°C on September 26. This was the warmest minimum temperature for so late in the year since 1872. Humidity was the main story with dewpoints in the teens and humidex values in the 30’s. In fact, 6 daily high dewpoint records were broken in Winnipeg during the warm spell, with a maximum dewpoint of 18.1°C on September 26. A maximum humidex value of 35.8 on the 26th was the latest occurrence of humidex over 35 on record since 1953.

October Warmth & January in November

After a brief cool down early October, things warmed up again mid-month with highs commonly in the teens. 2 days exceeded 20°C. A high of 20.6°C on October 24 was the warmest for so late in the year since 1990. Thanks to generally warm conditions in October, The Forks weather station did not report its first freeze until October 30!
Of course, winter came in viciously in mid November with a prolonged cold snap lasting until the beginning of December. A low of -29.6°C at Winnipeg Airport on November 26 was the coldest in November since 1996. We only reached a measly high of -19.3°C on the 26th and 30th, the coldest highs in November since 1985.

Dry Fall

It was also a fairly dry fall, as many of you have probably noticed. Only around 60 mm of precipitation fell in Winnipeg, making it about the 18th driest fall on record since 1872. October was driest with just 4.9 mm of precipitation (all rainfall), the 3rd driest October on record.

The Year So Far

2014’s standing in terms of temperature has improved (warmed) slightly since the summer summary in September, thanks to warmer conditions in September and October. This January to November period averaged 2.3°C or 2.1°C below the 1981-2010 normal for the period. It is the 22nd coldest since 1873 and coldest since 1996, which is an improvement from the 17th coldest January to August period.

Monthly & year-to-date temperature deviations through Fall 2014 in Winnipeg, MB.

391.4 mm of rain has fallen this year up to now, which is actually about 37 mm below normal for an entire year. The deficit in rainfall can be attributed to a very dry fall and below normal rainfall in the spring.