Surface Plots
Prairie Plot
![](https://climate.cod.edu/data/surface/canprairies/contour/current/CP.fronts.gif)
N. Plains Plot
![](https://climate.cod.edu/data/surface/nrnplains/contour/current/NGP.fronts.gif)
National Plot
![](https://climate.cod.edu/data/surface/US/contour/current/US.fronts.gif)
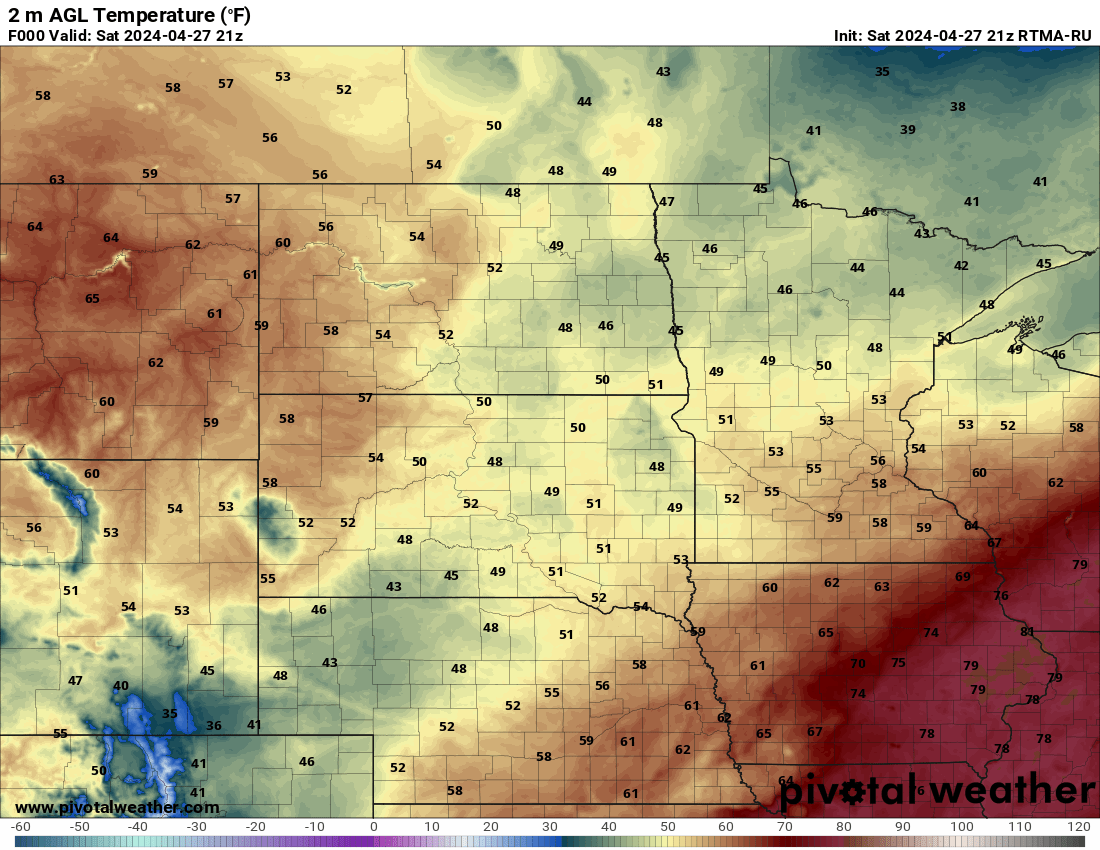
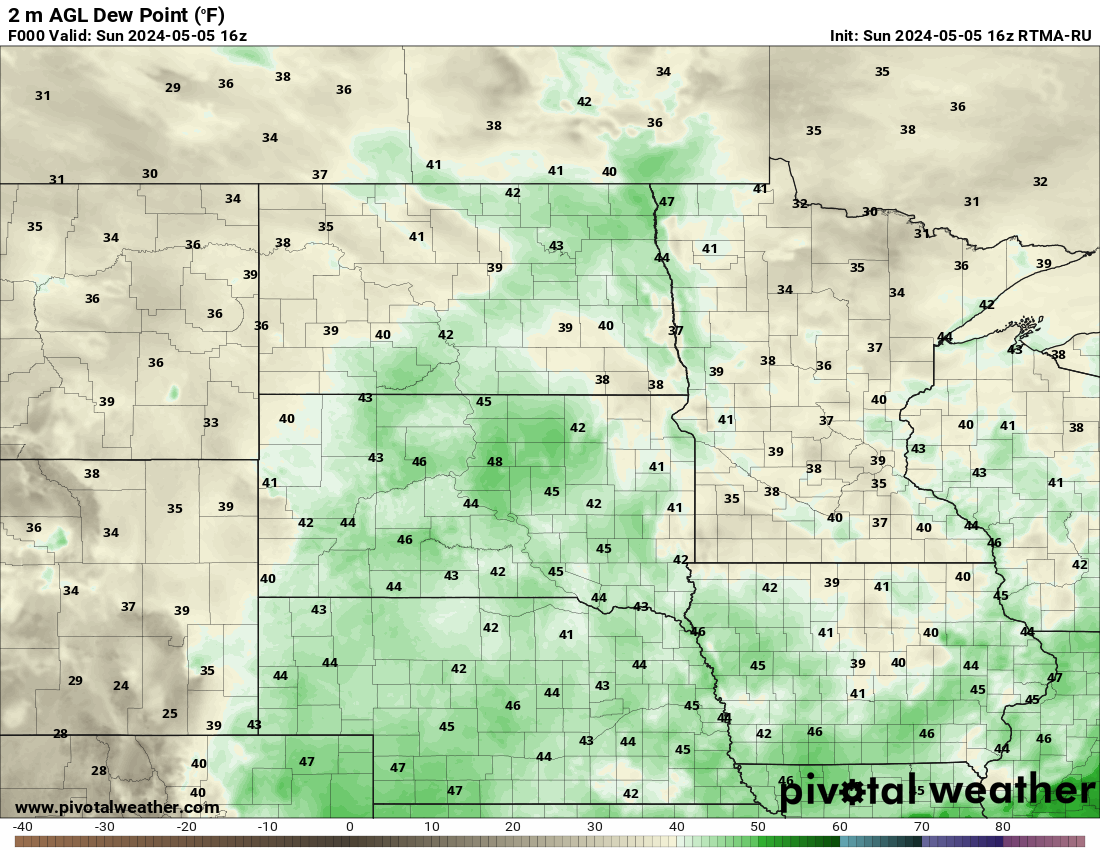
Pivotal Weather Regional Plots (in Fahrenheit)
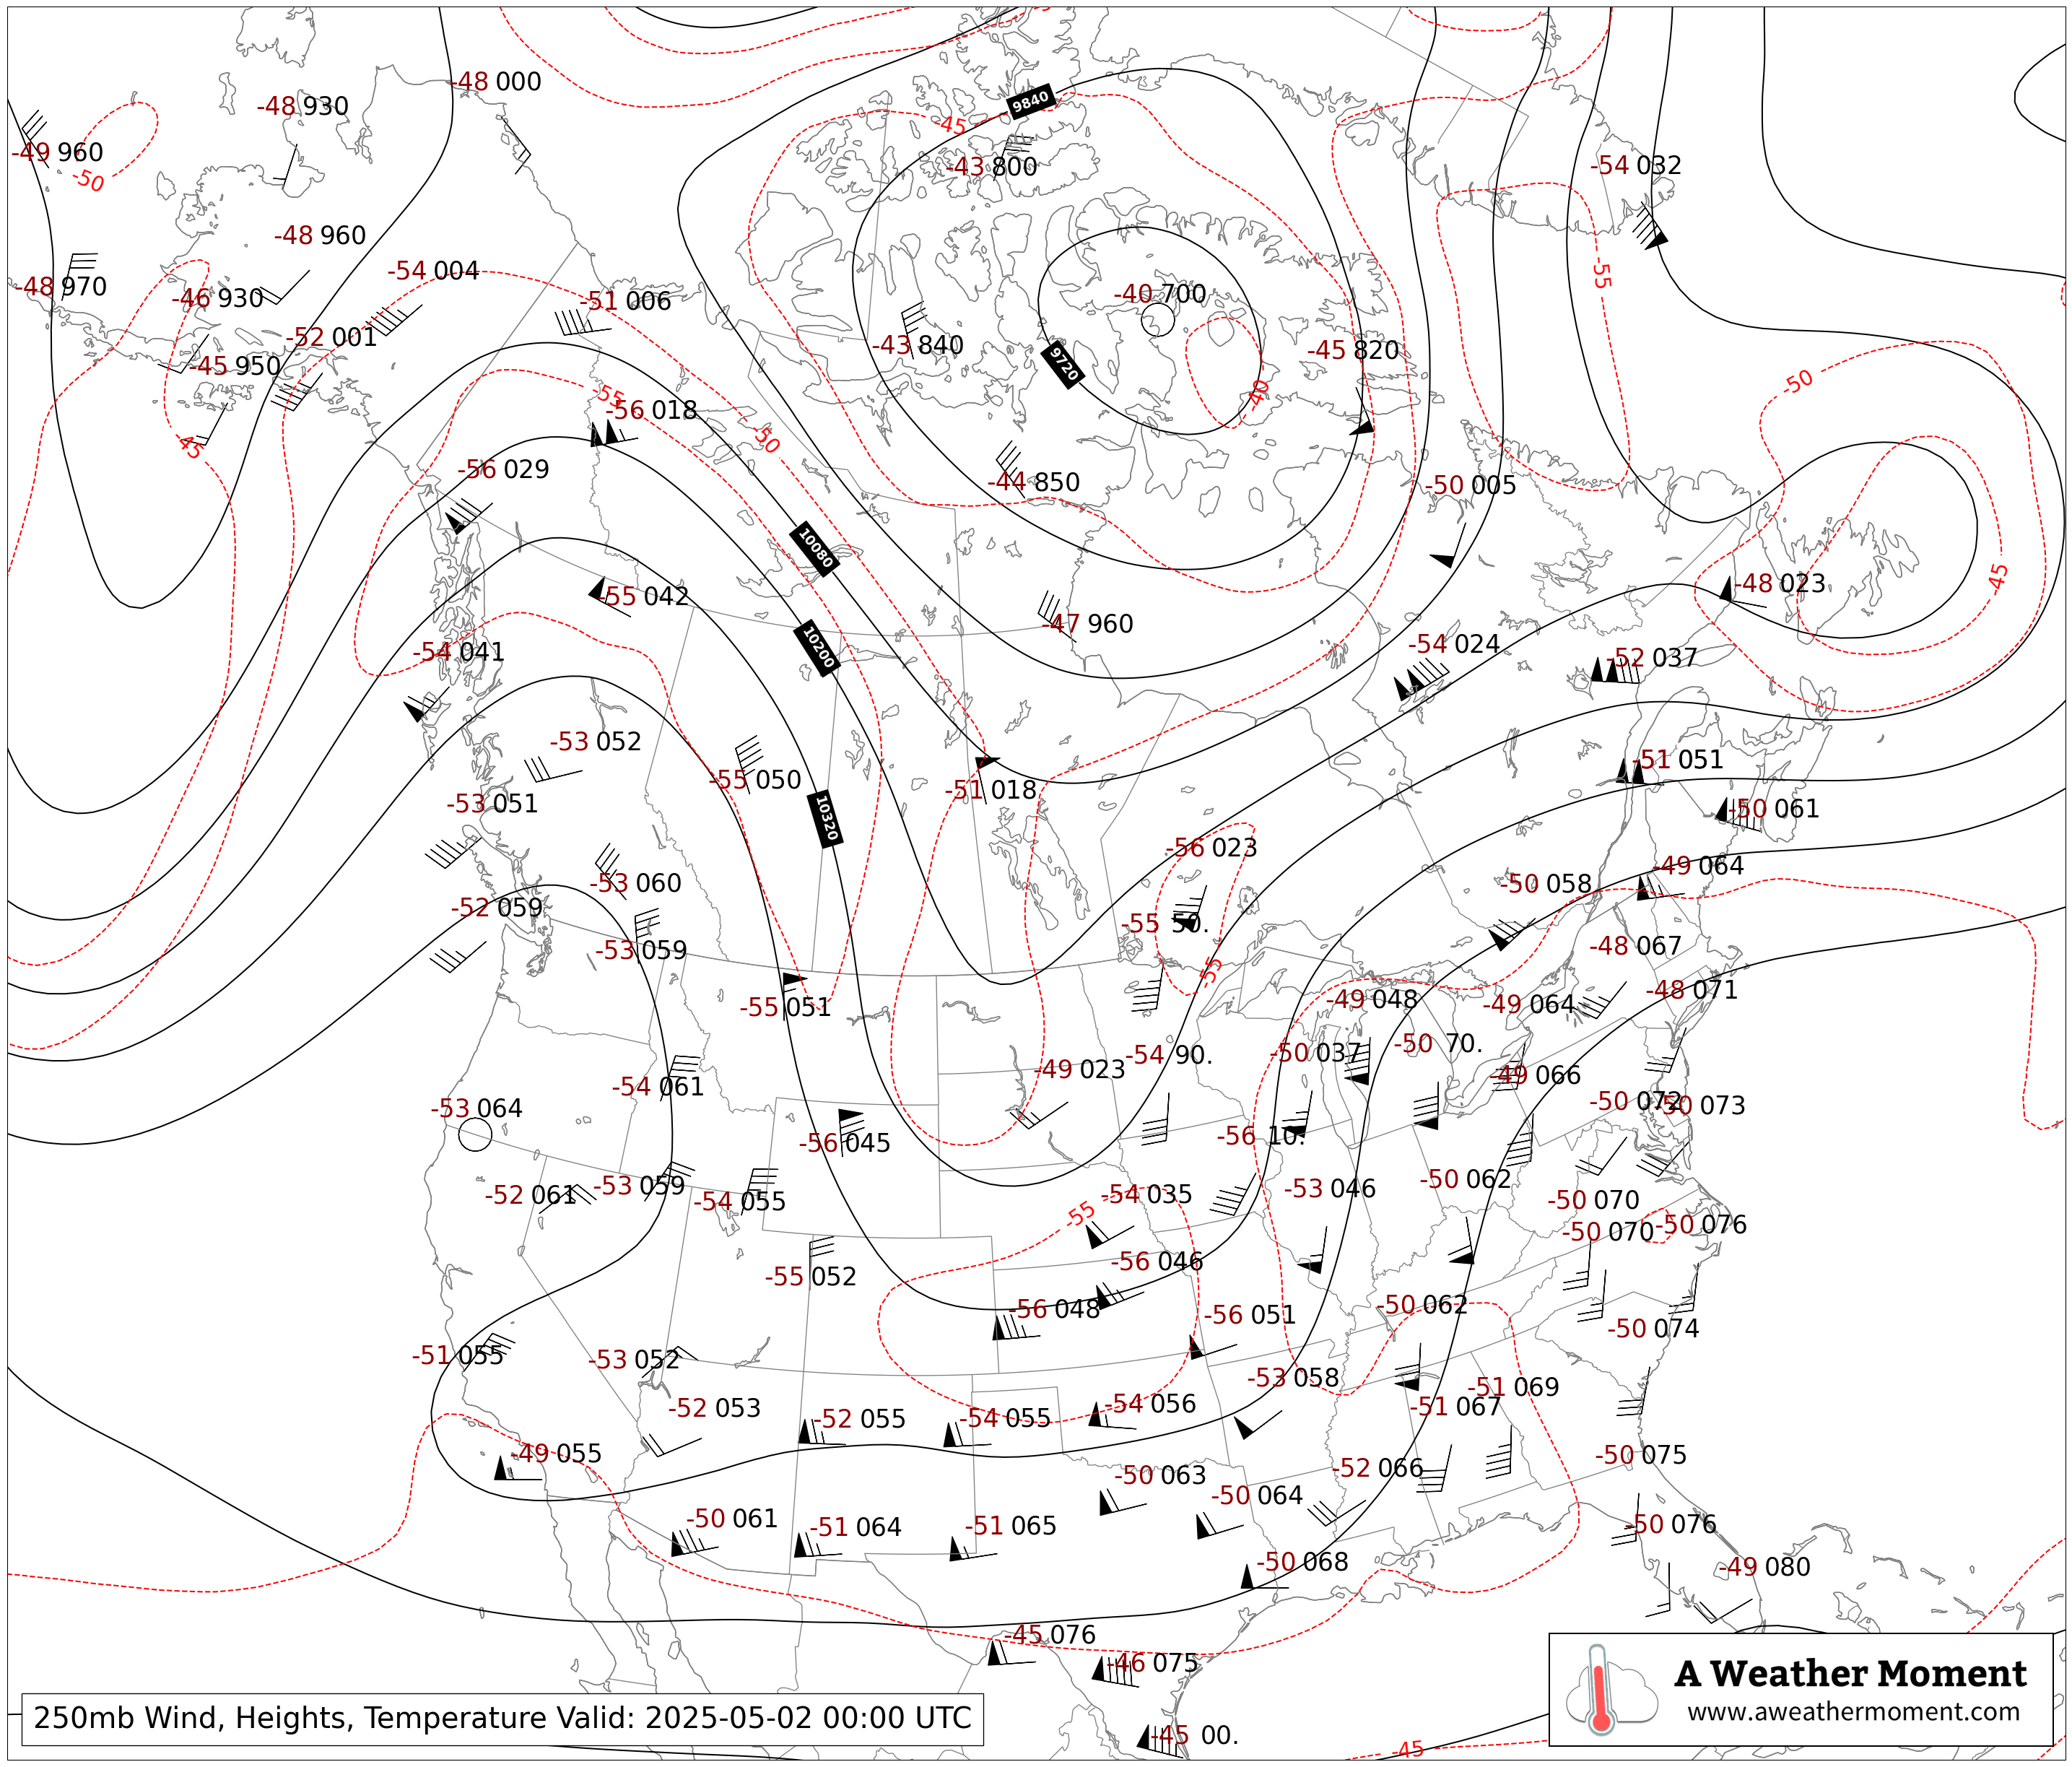
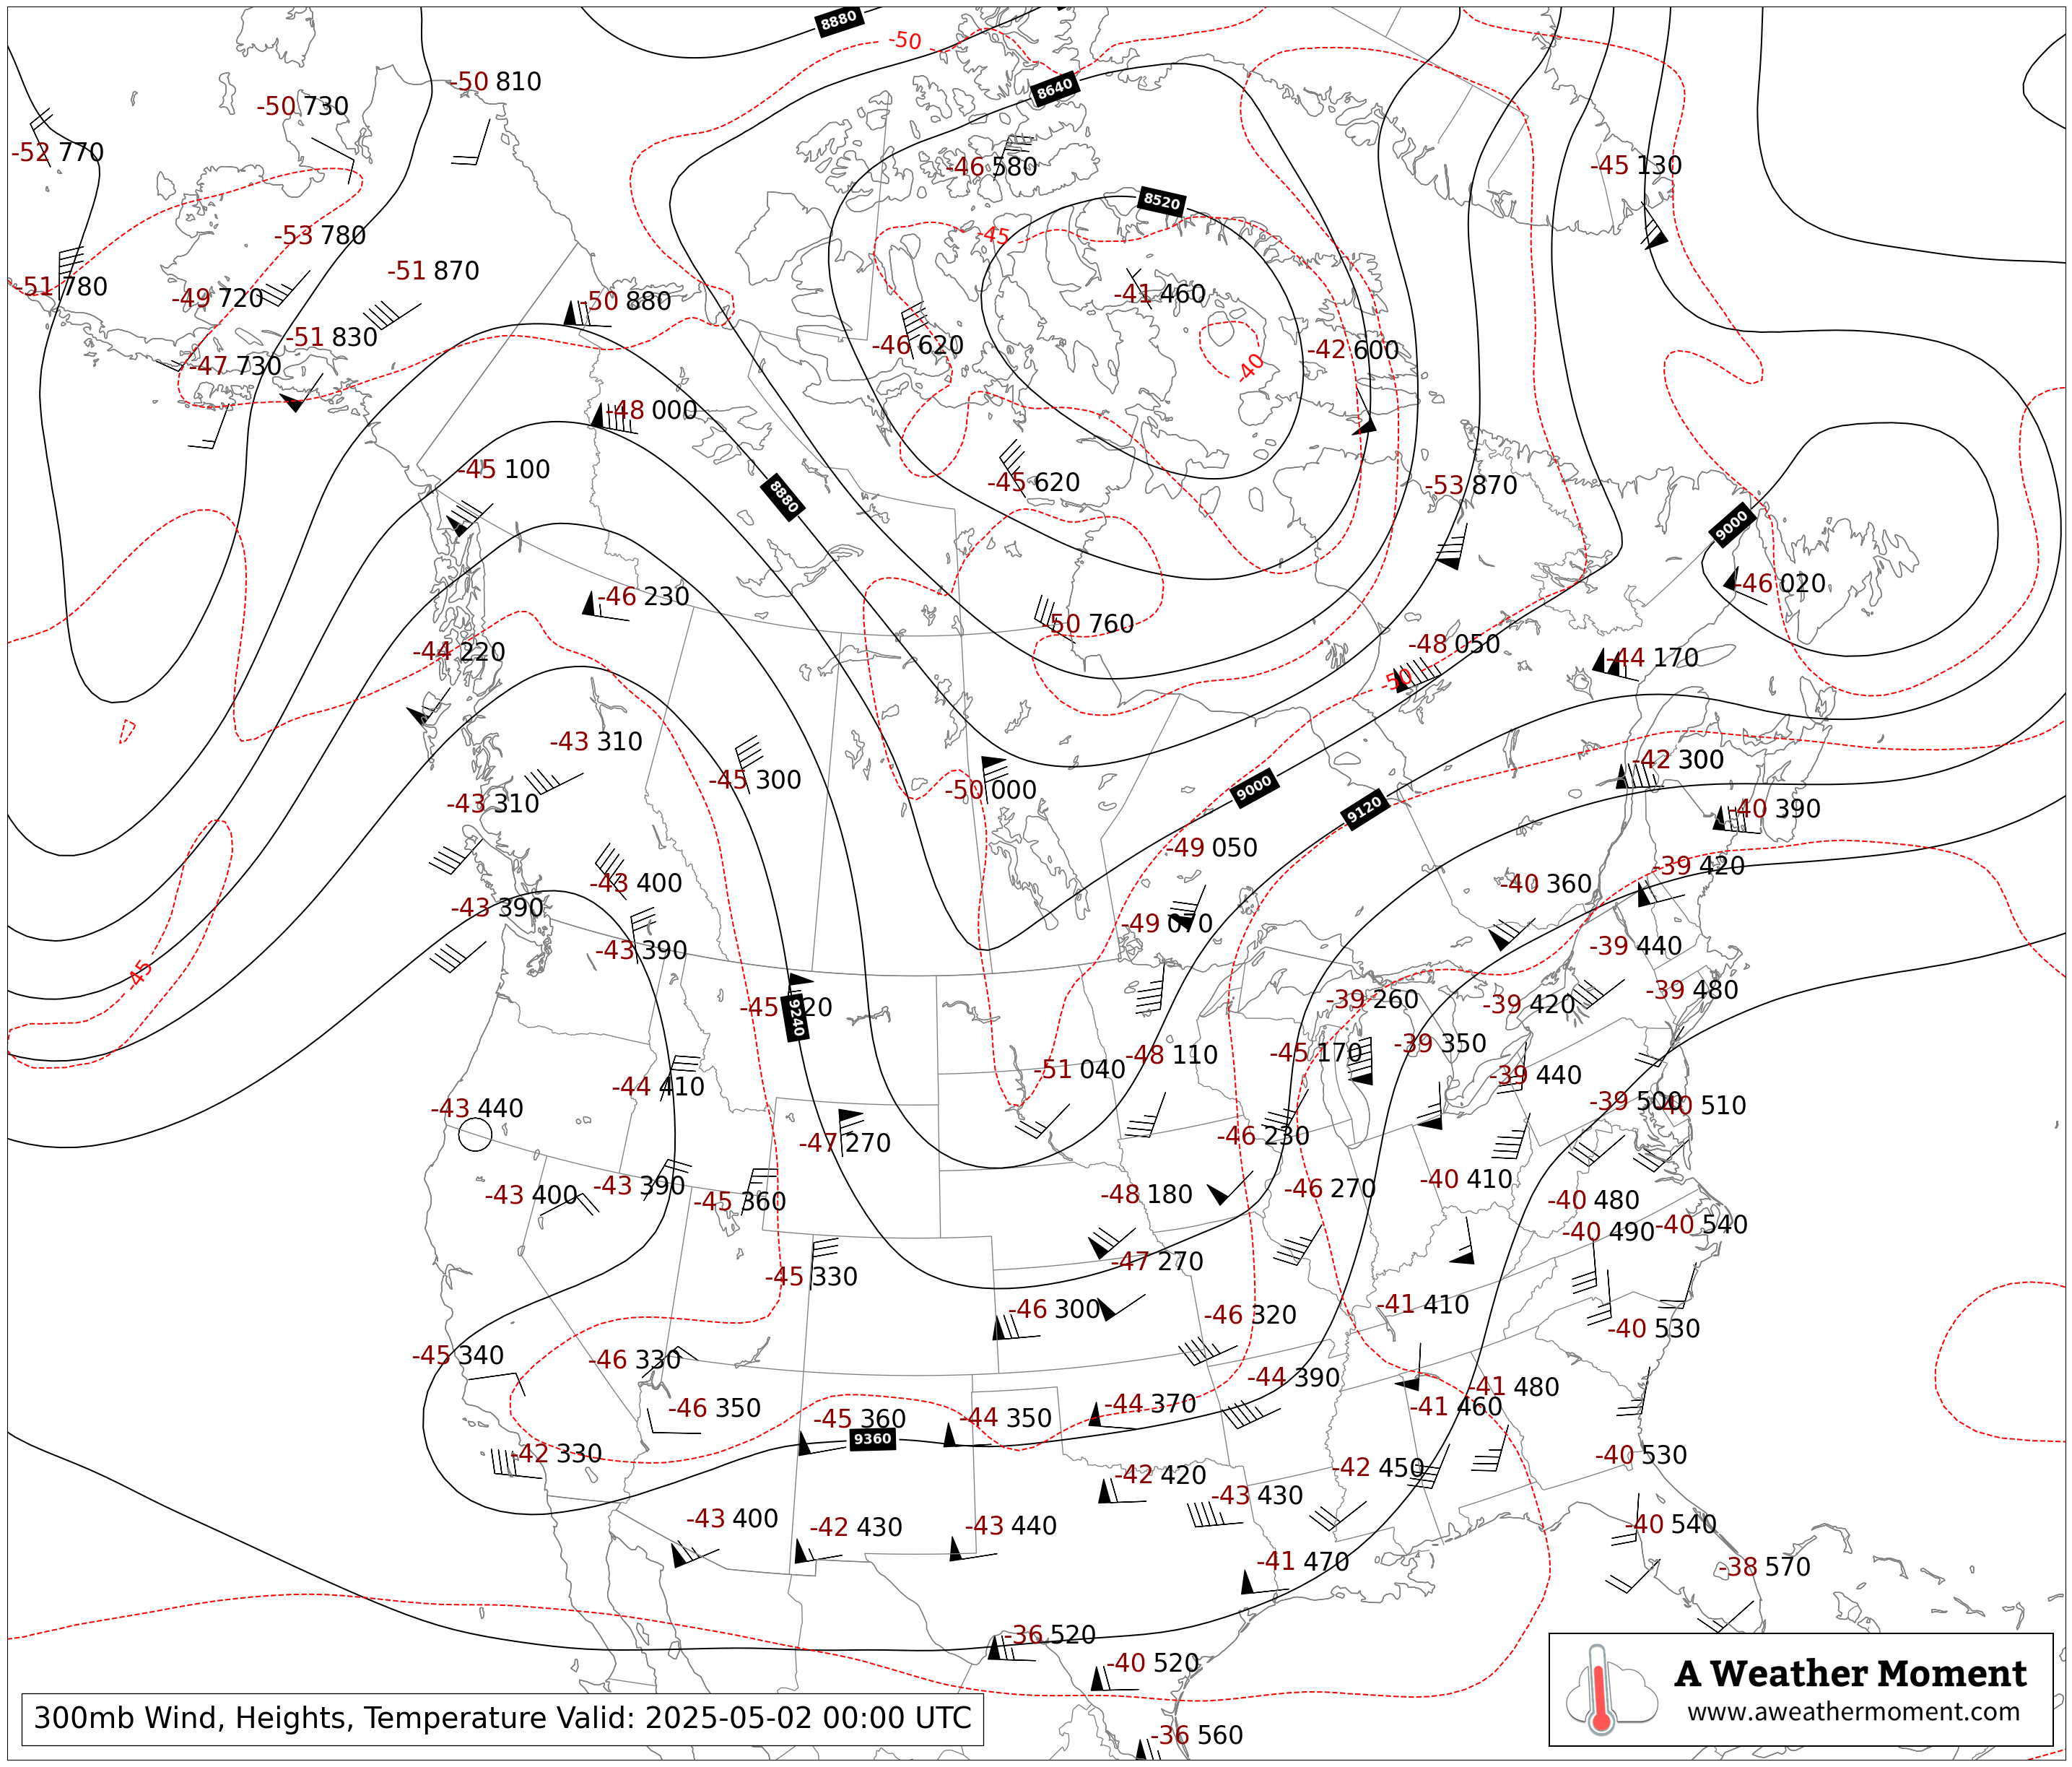
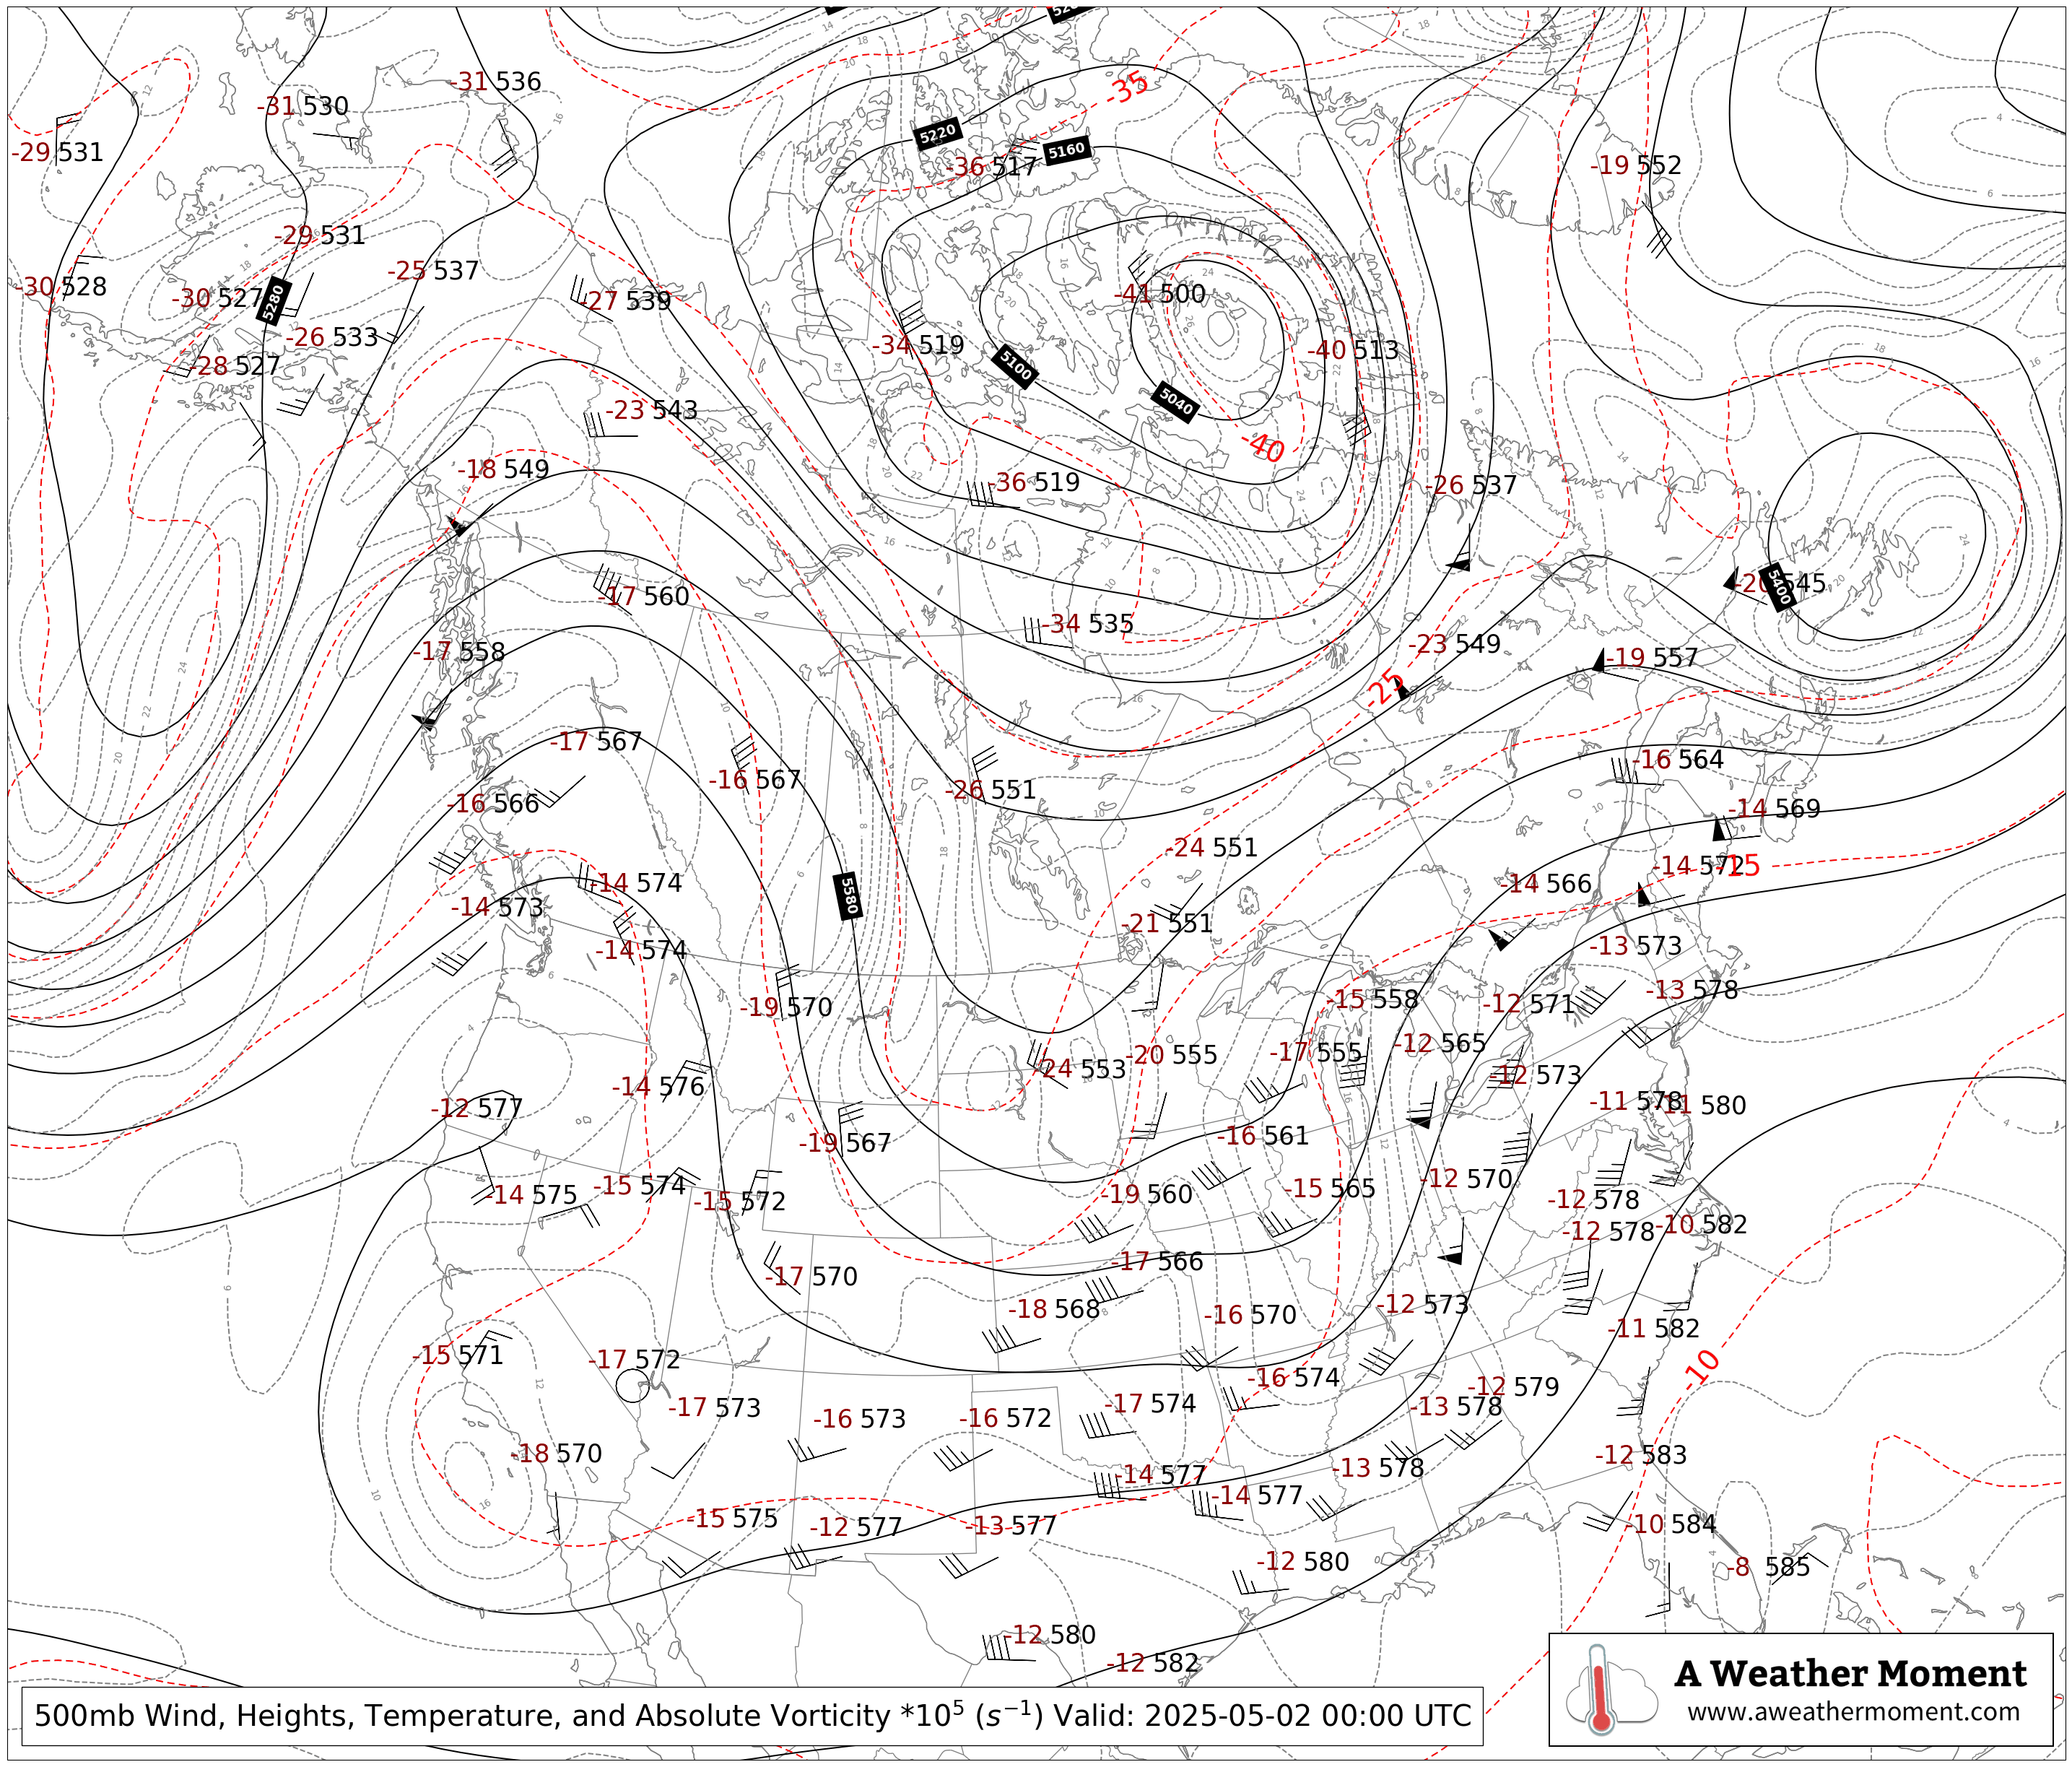
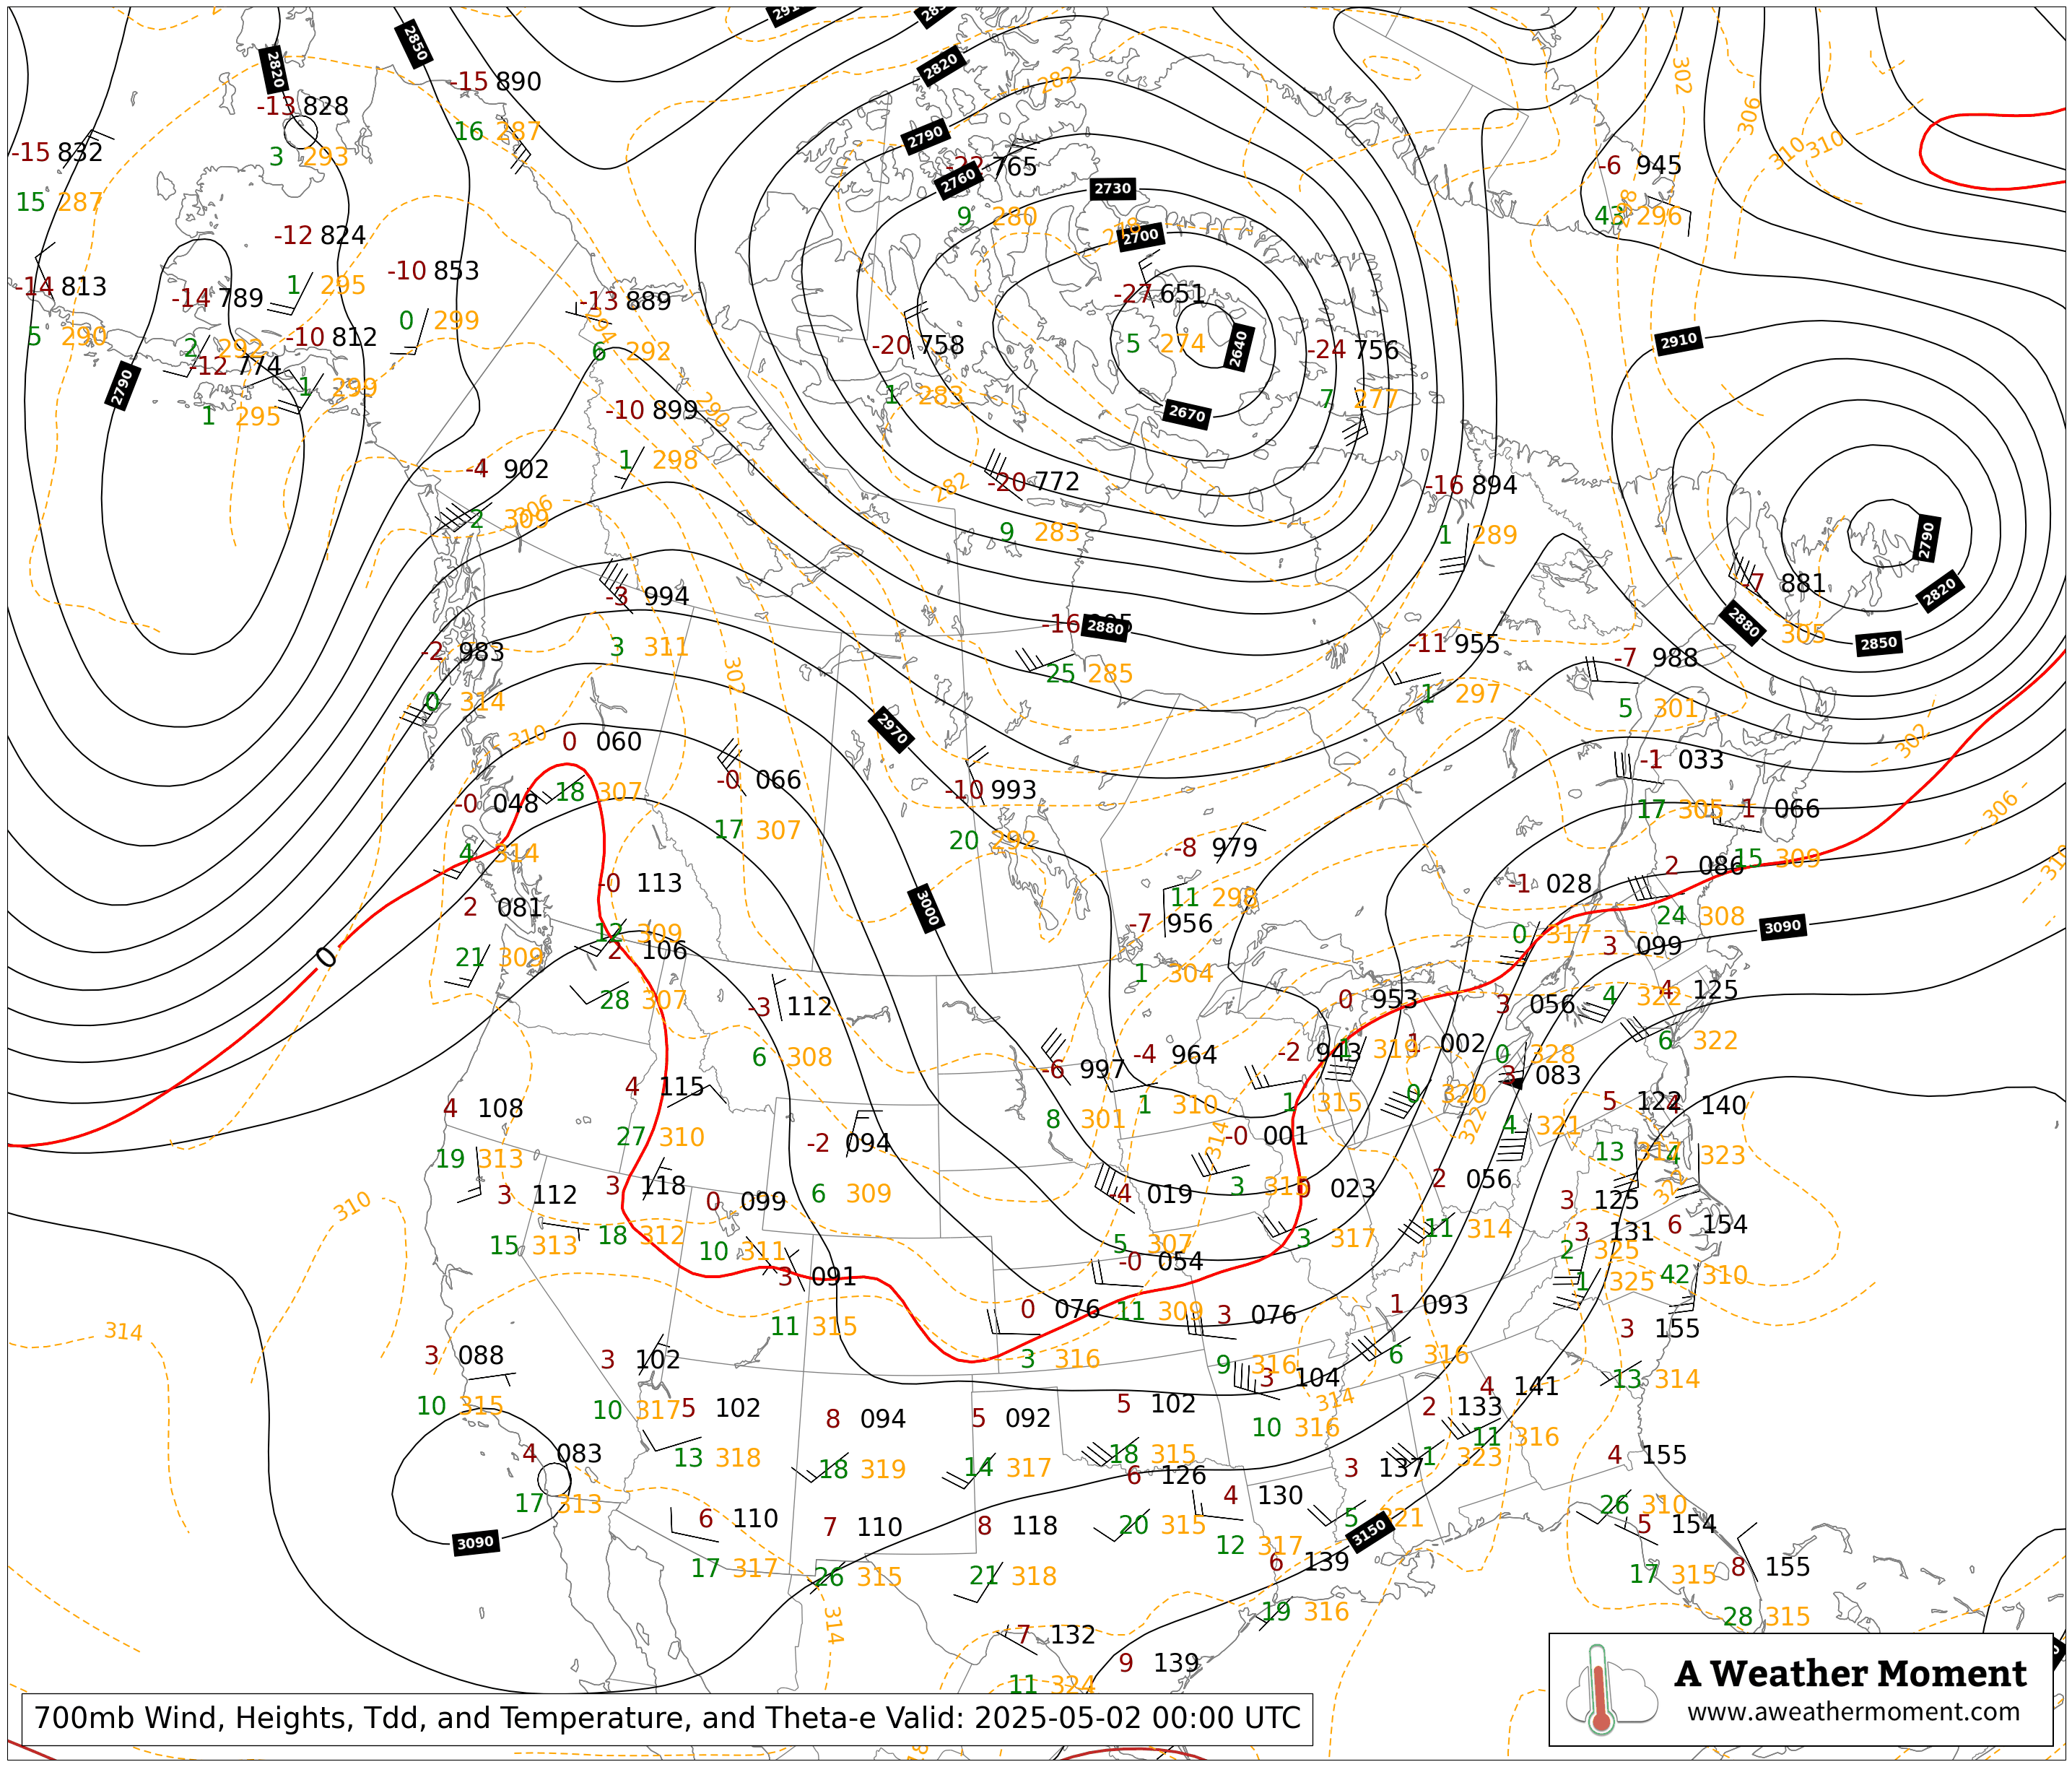
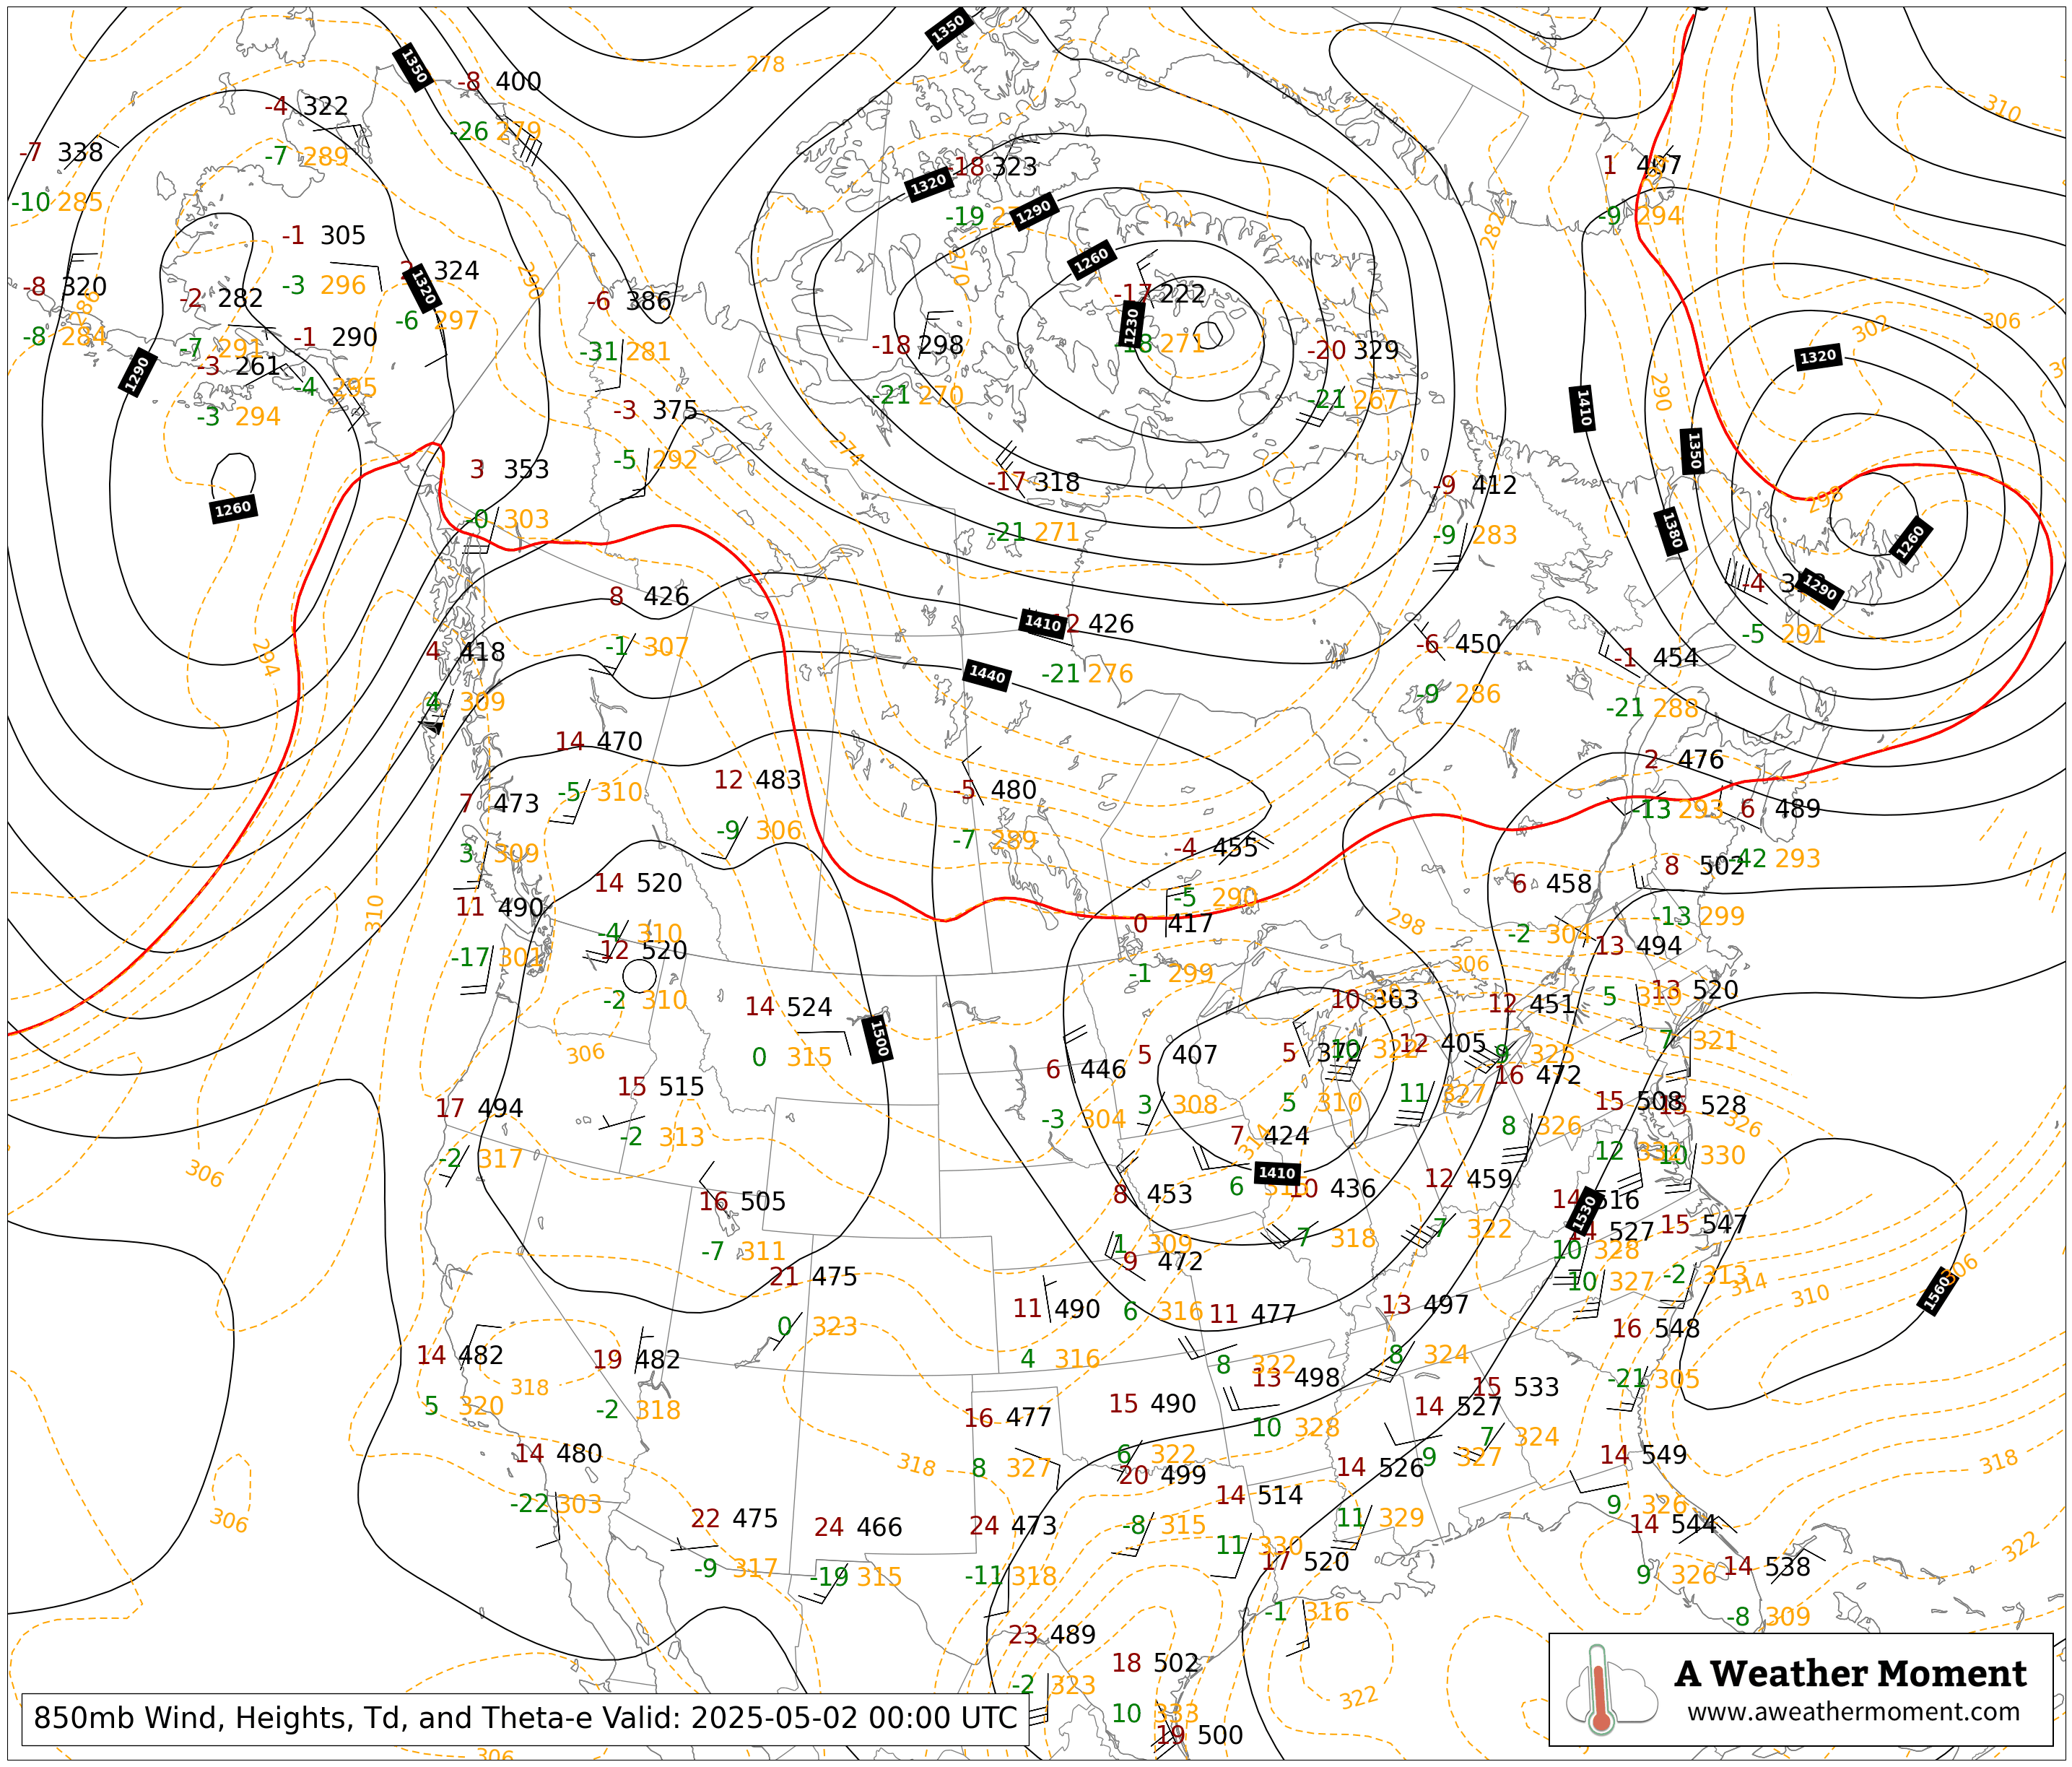
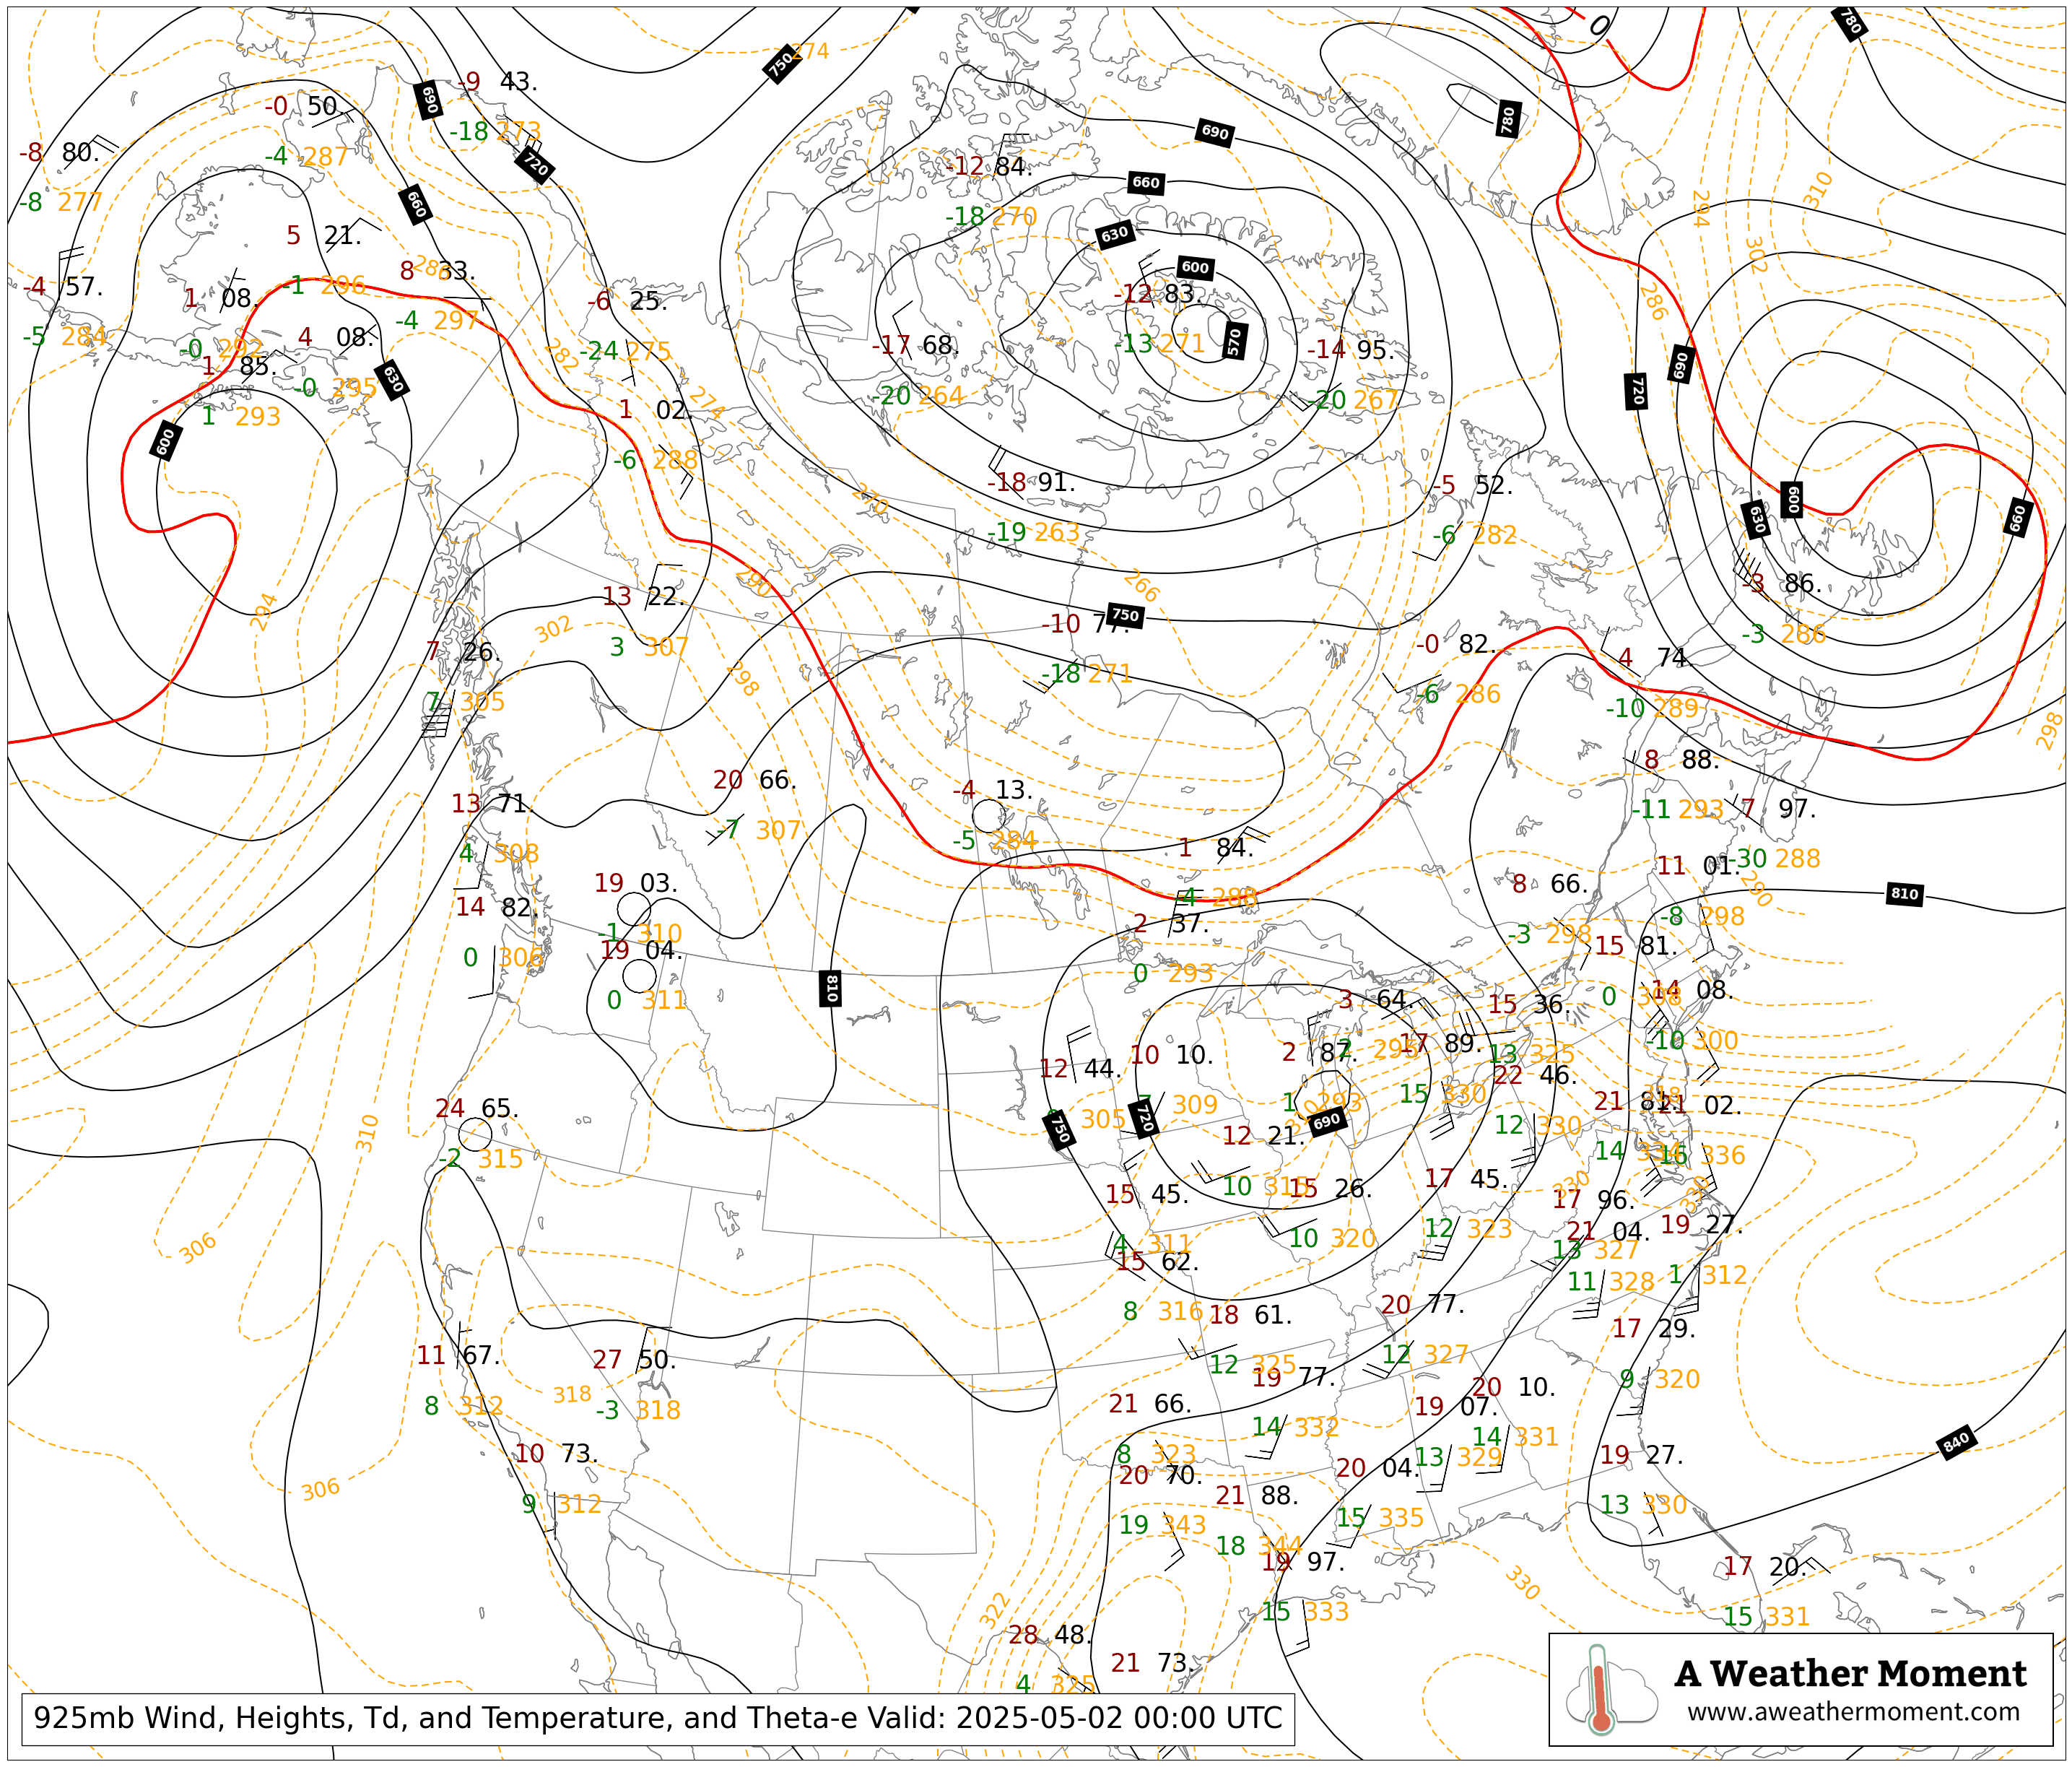
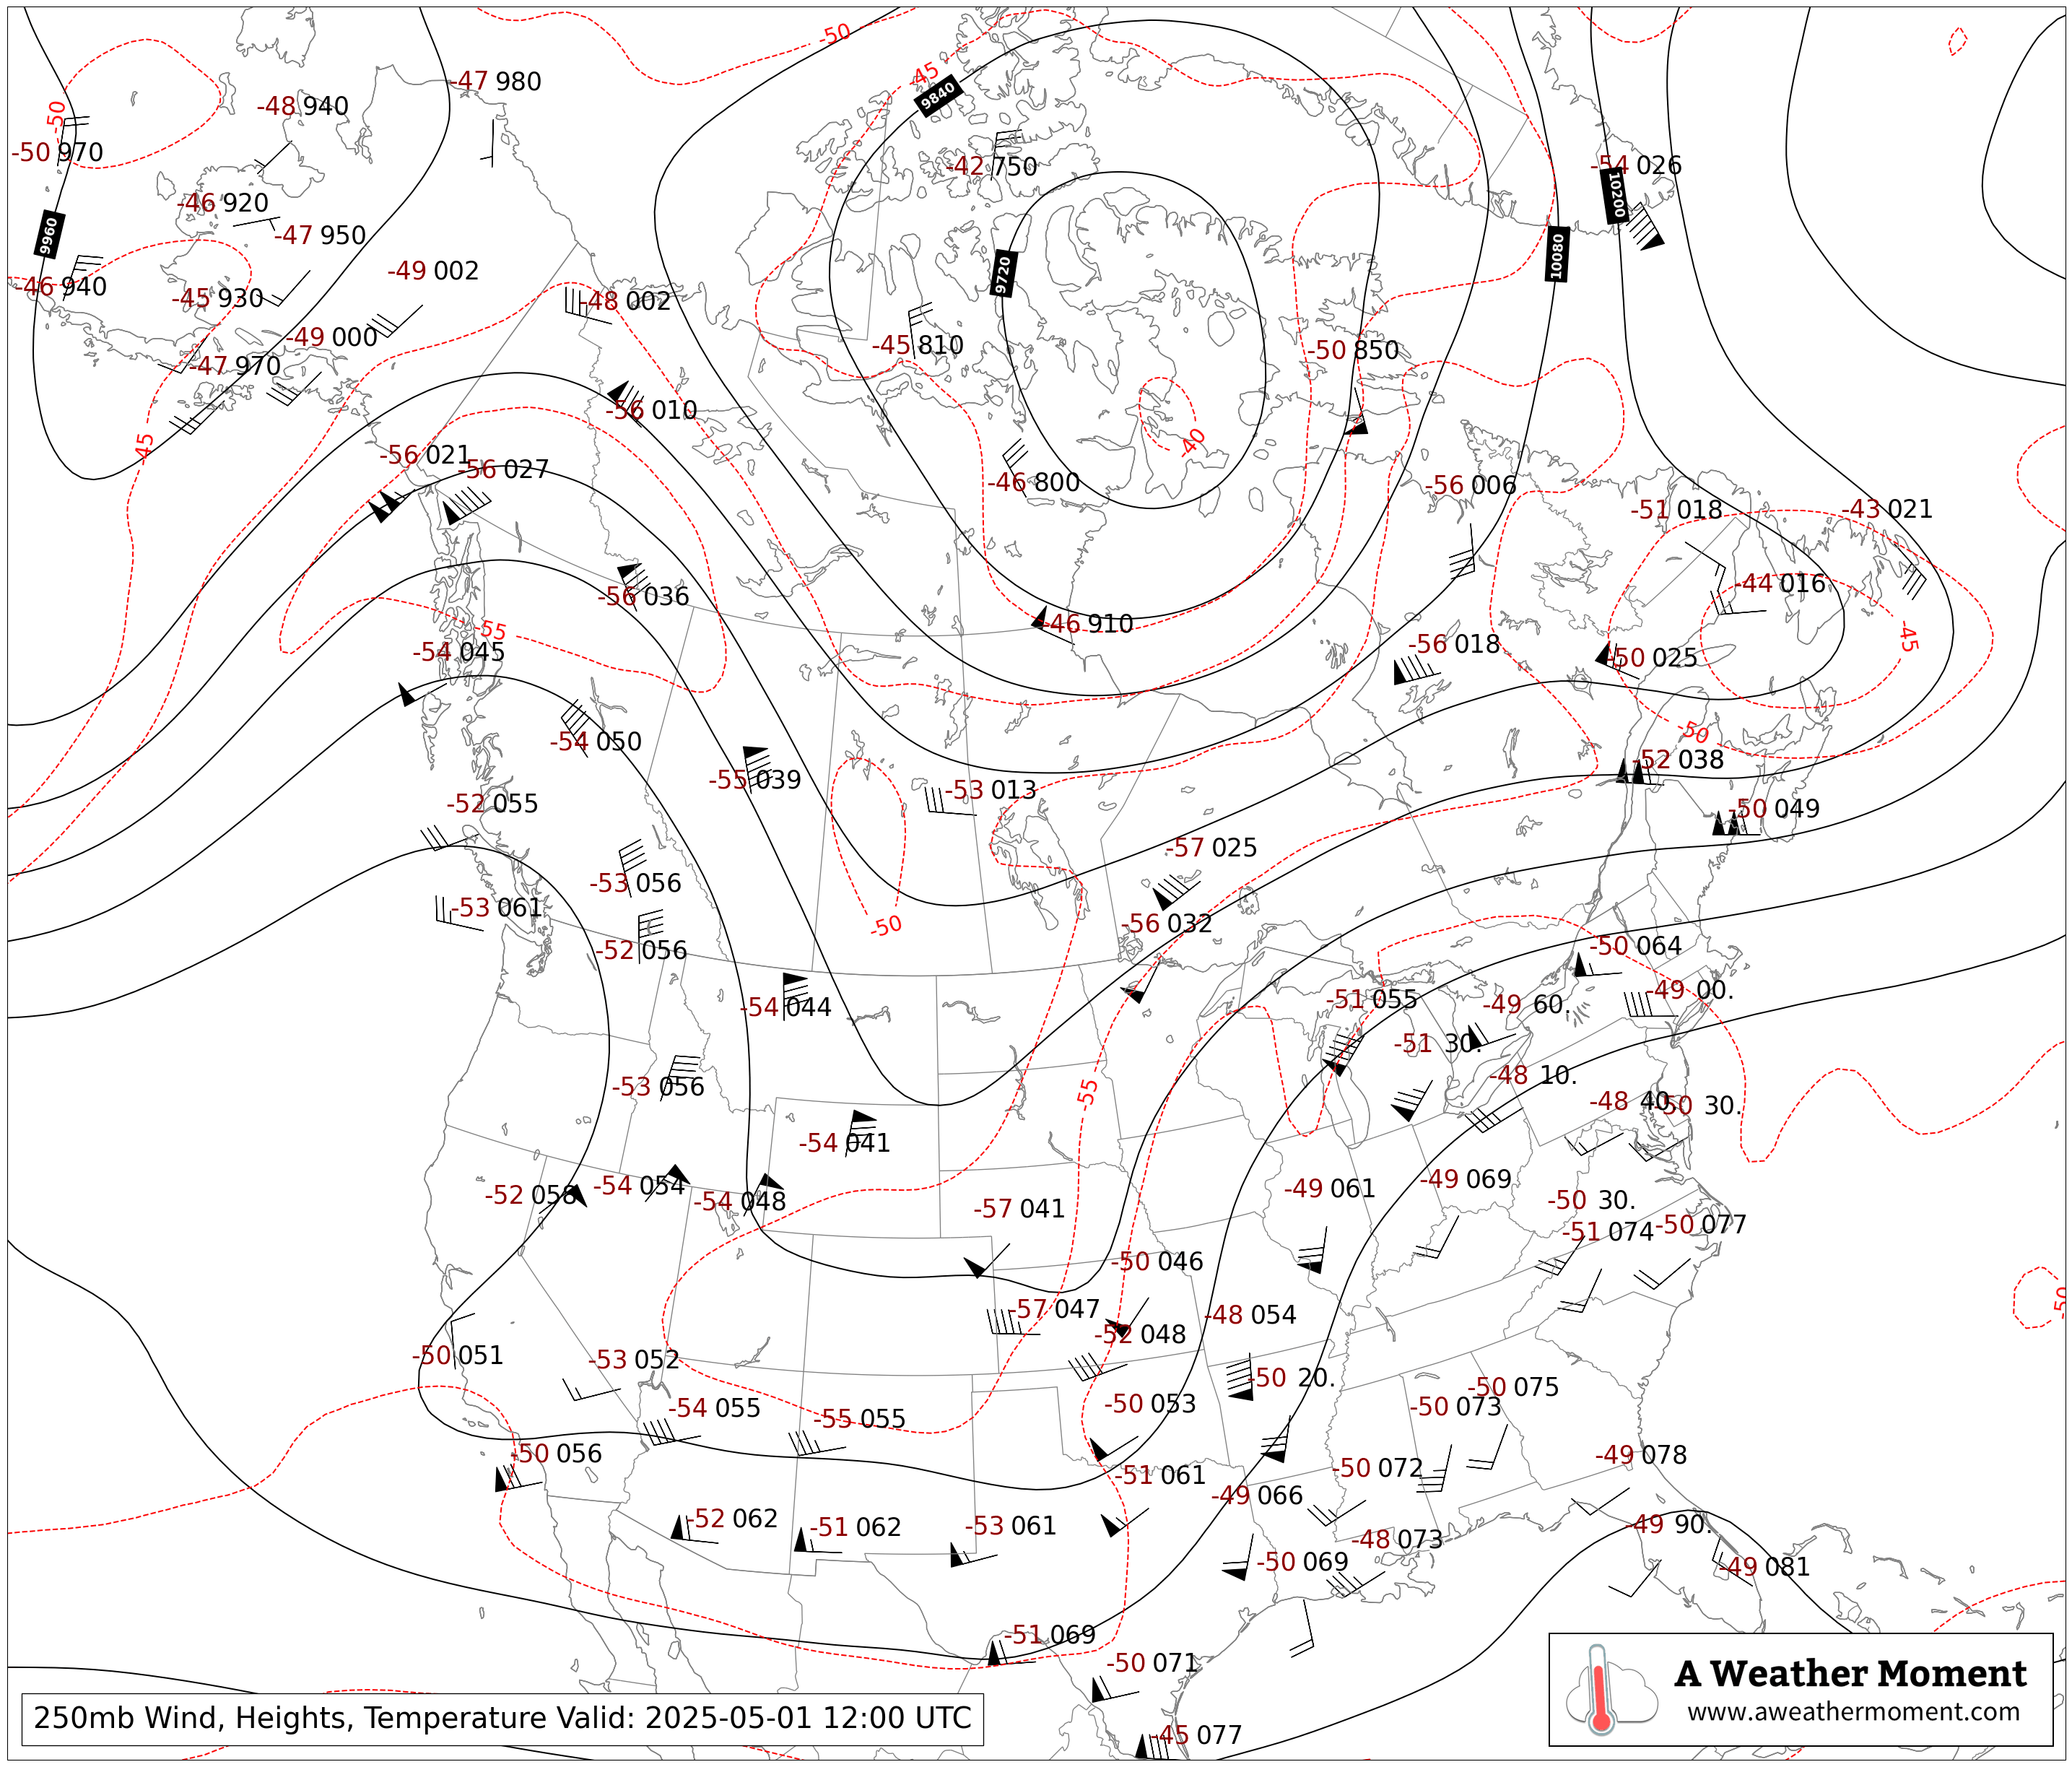
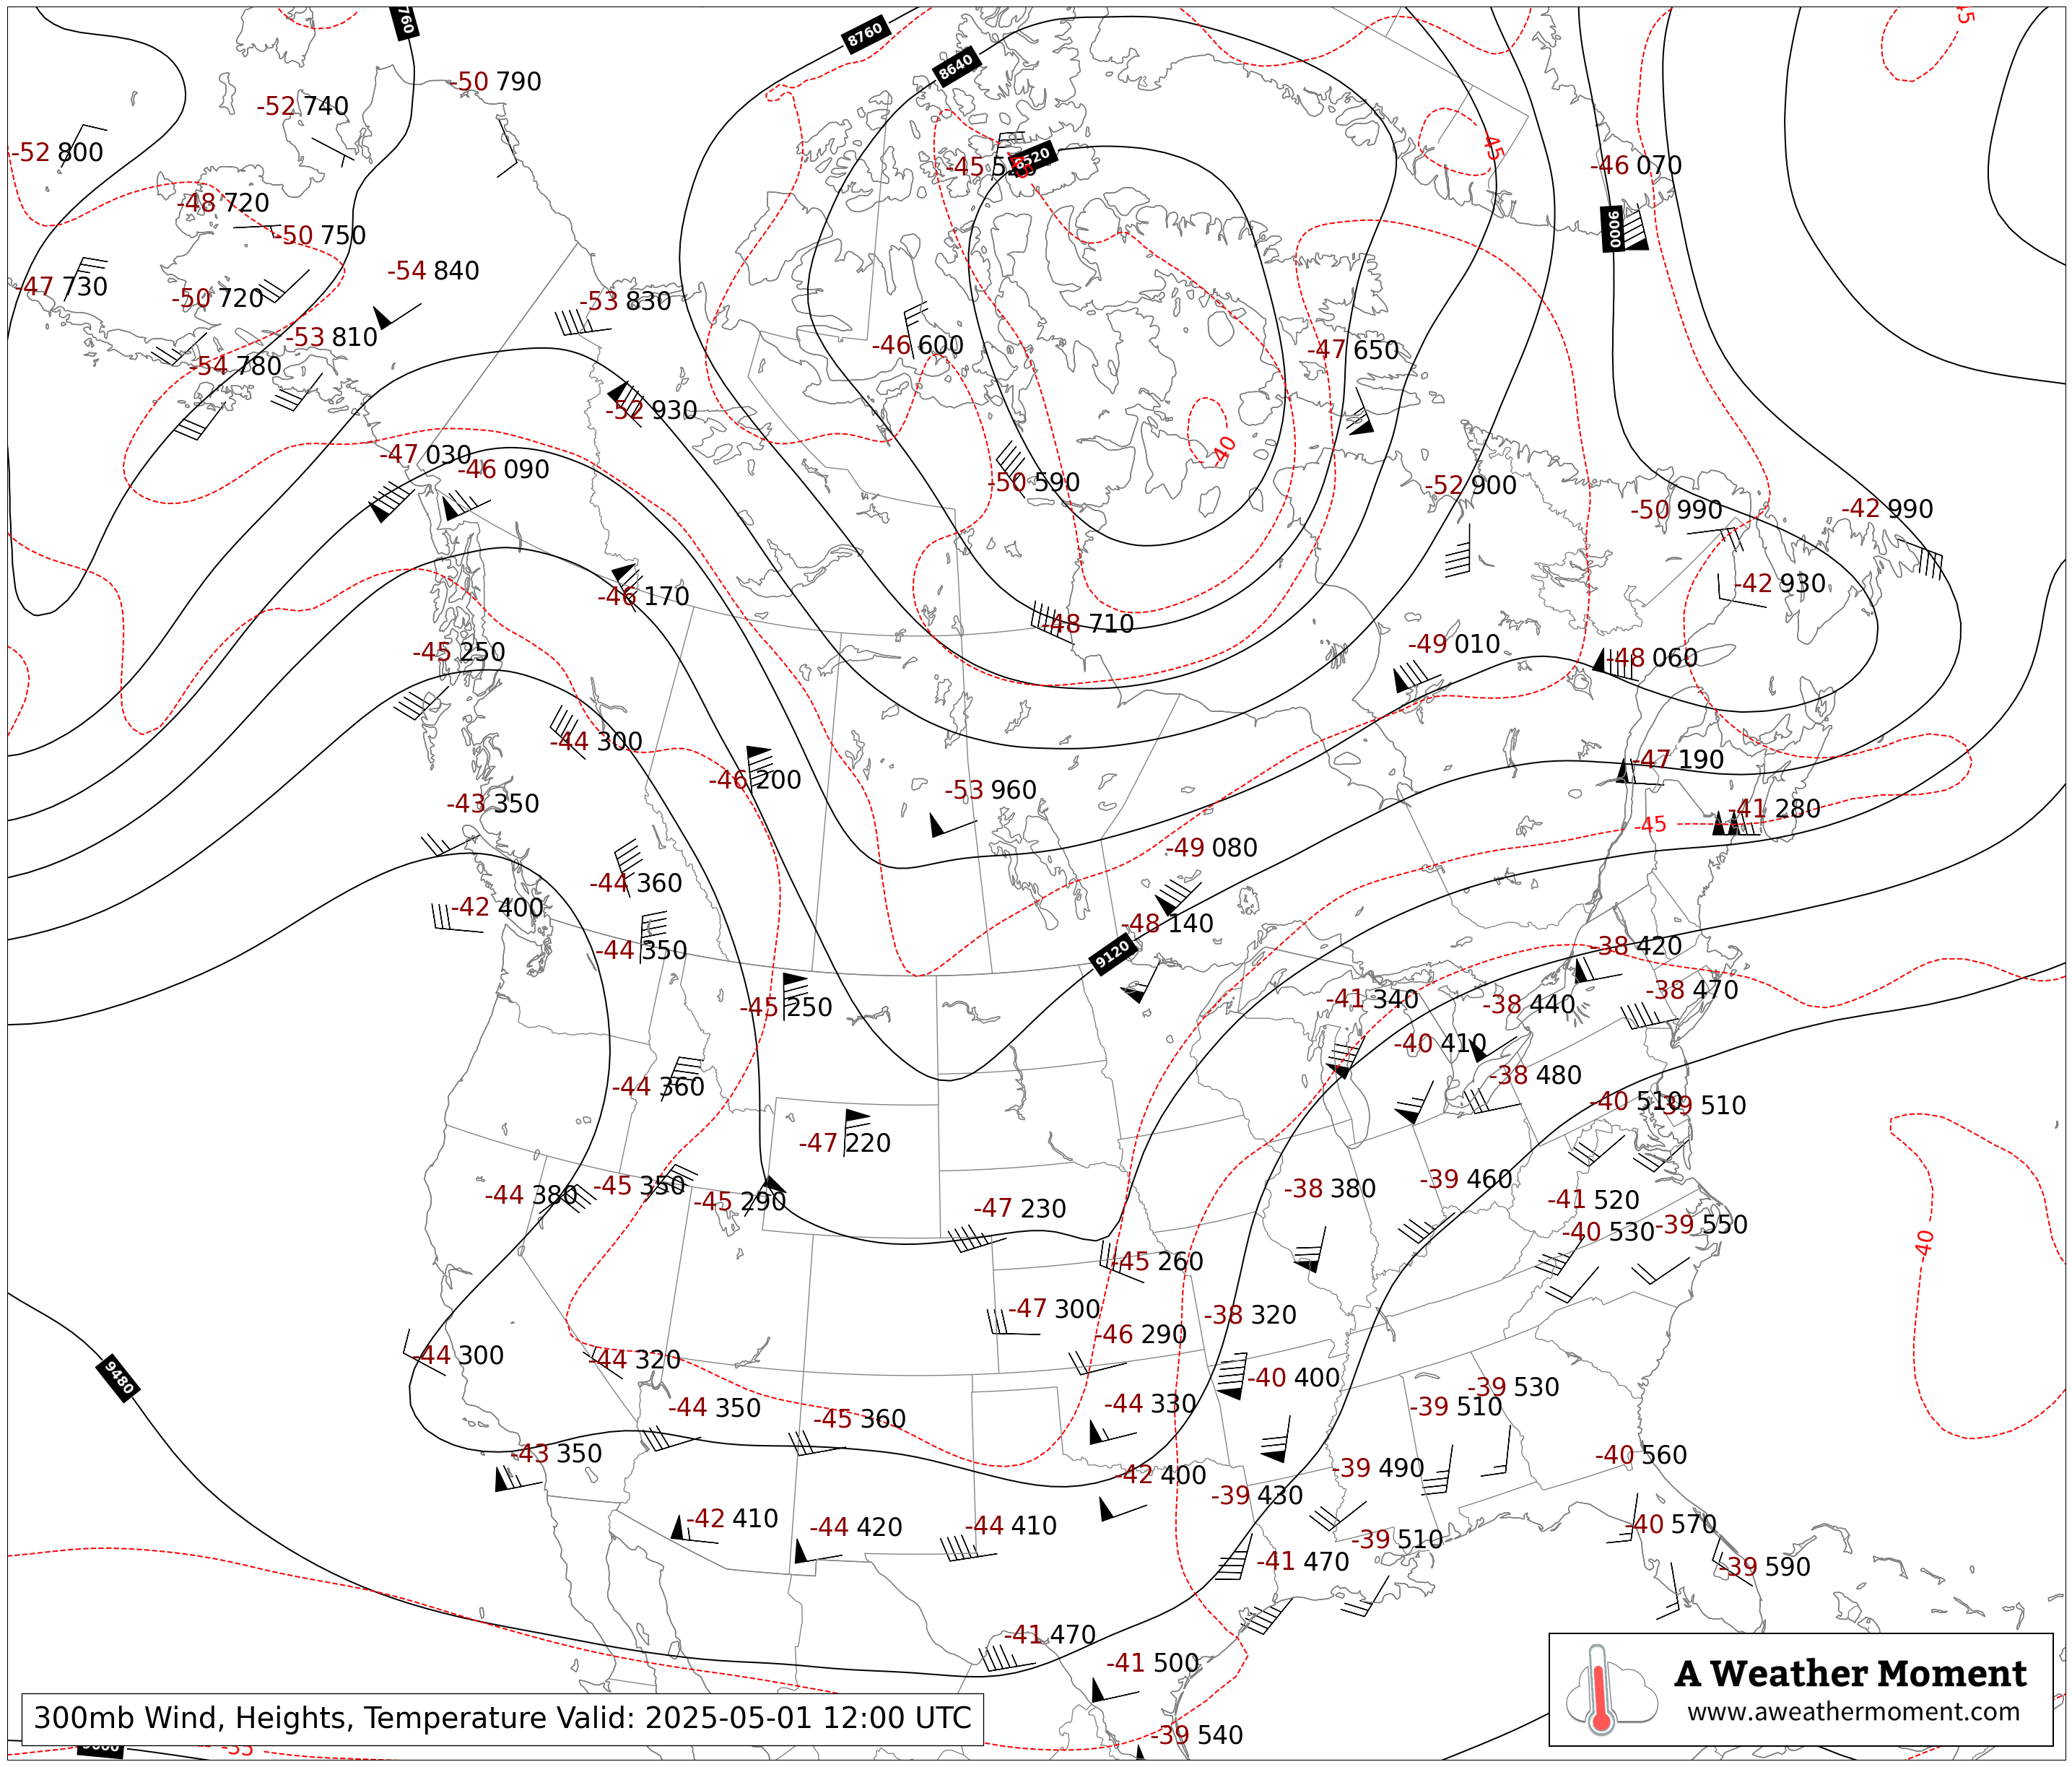
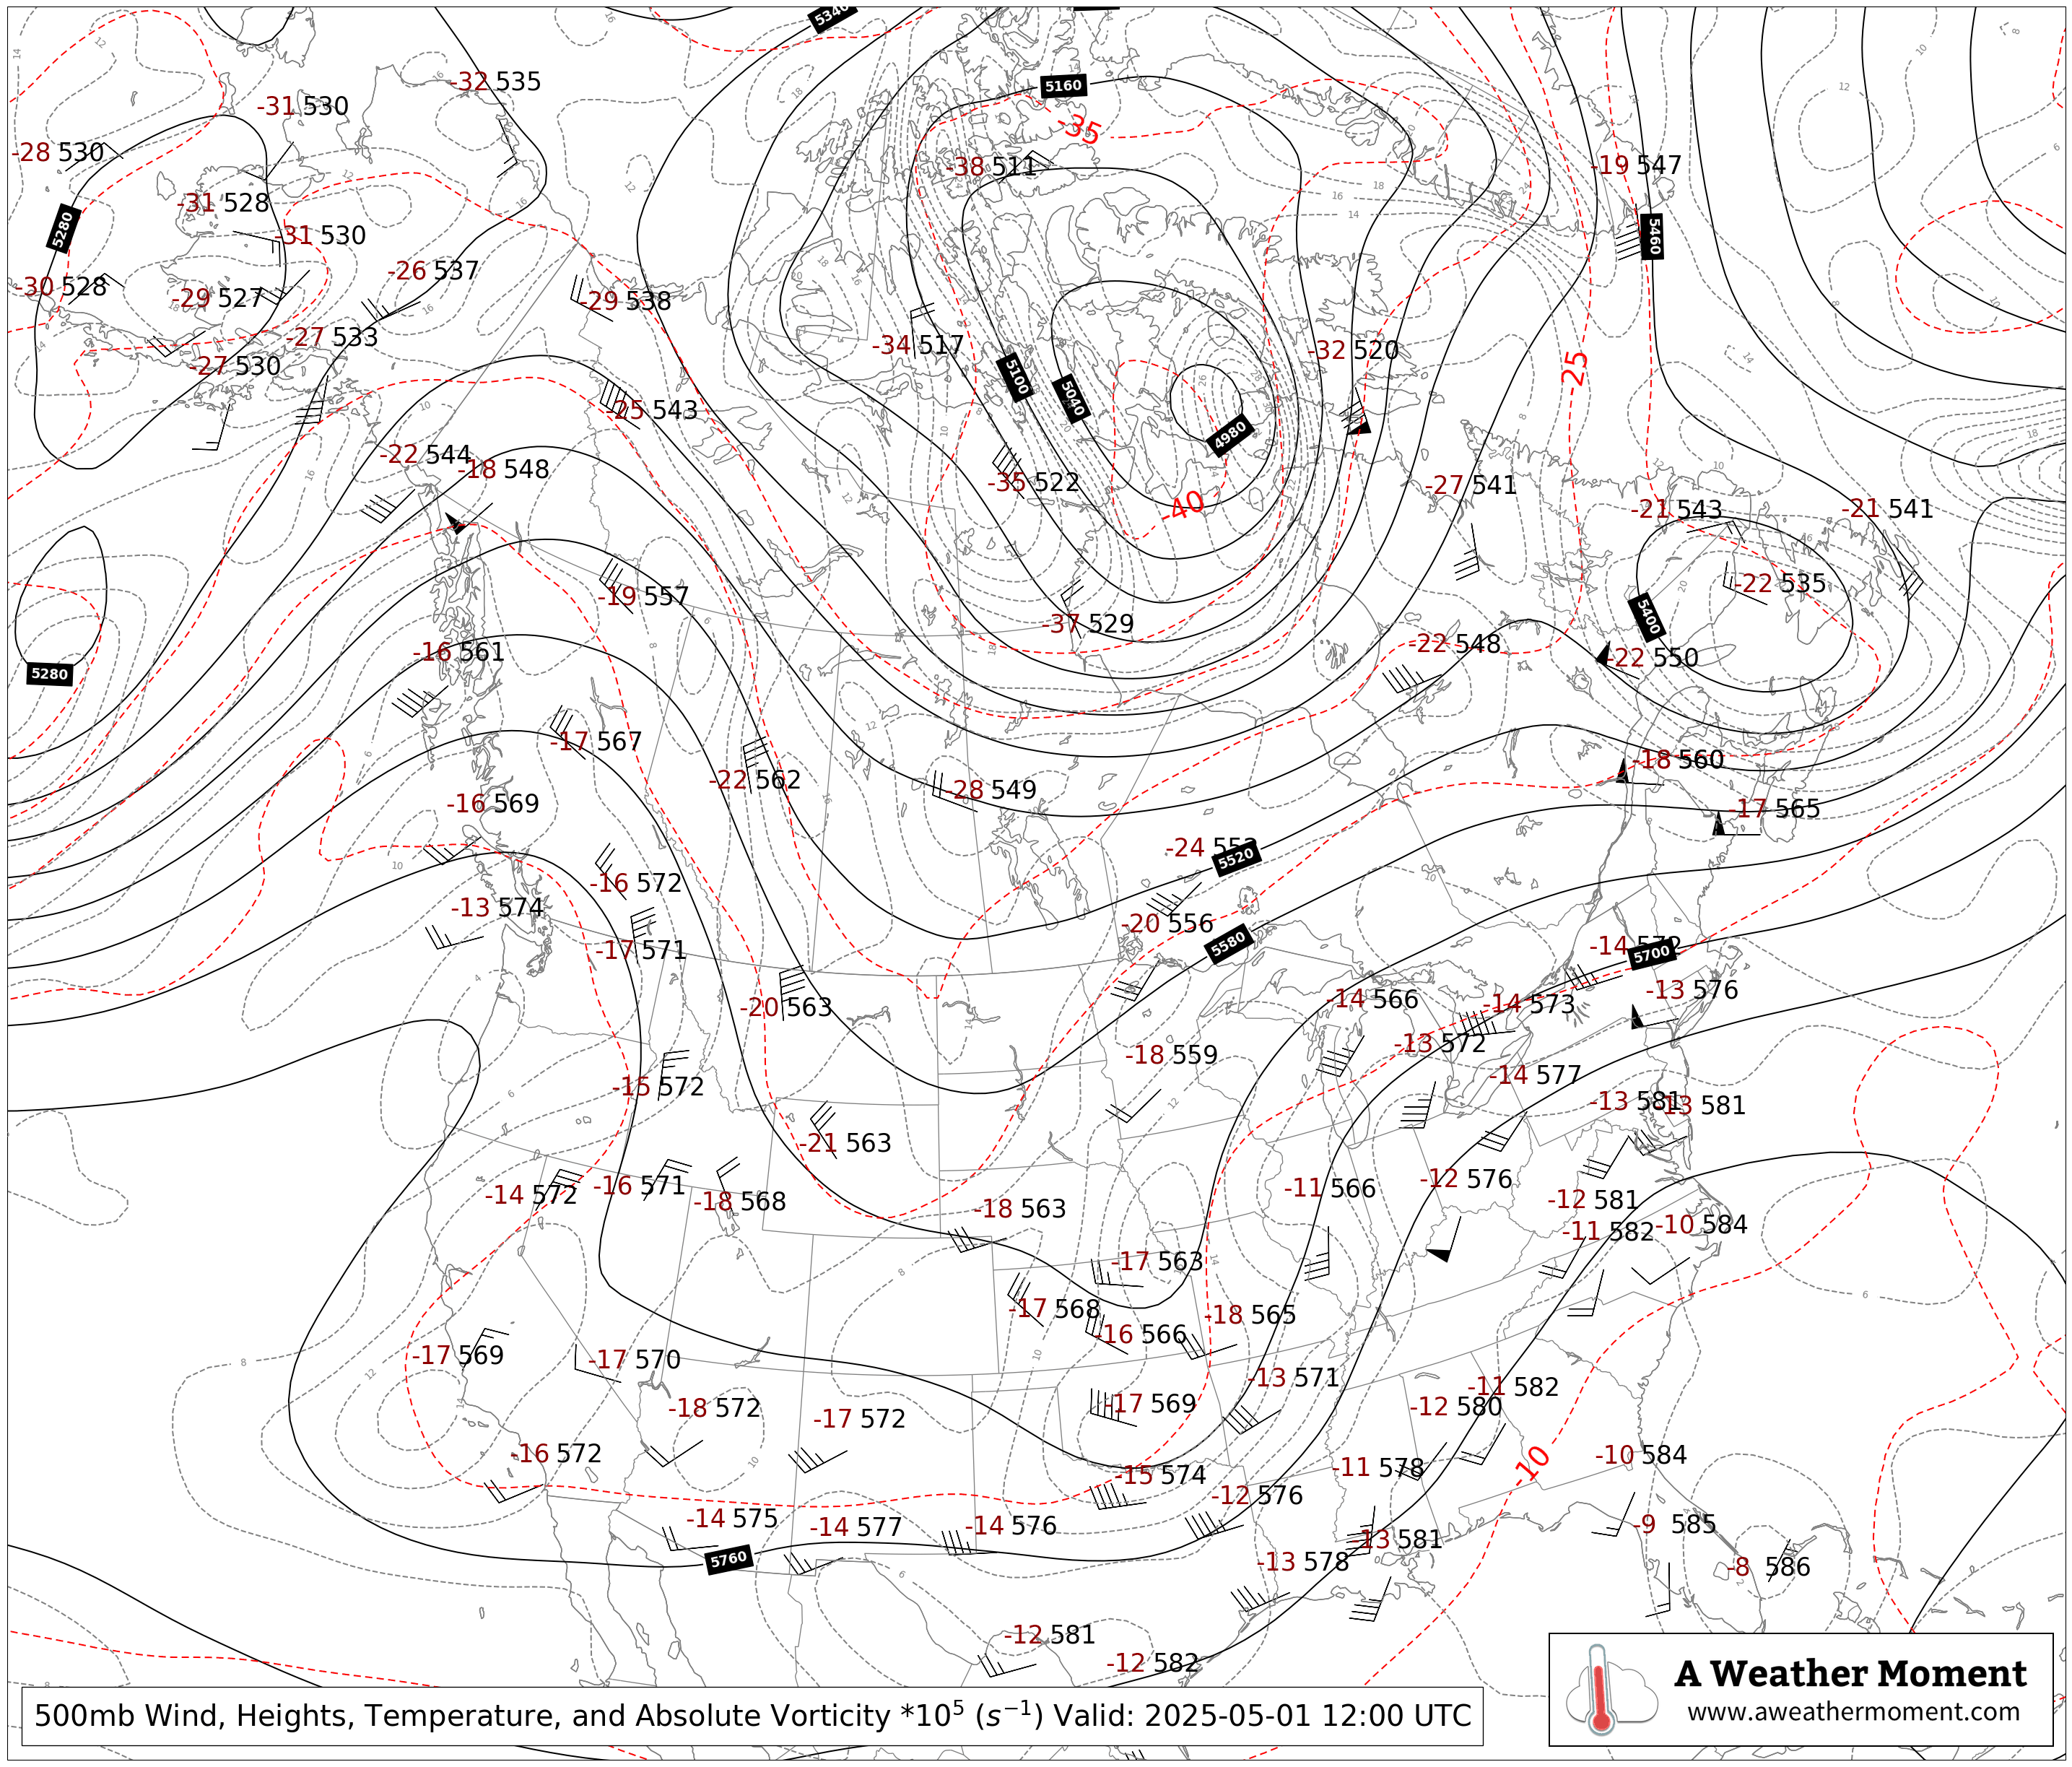
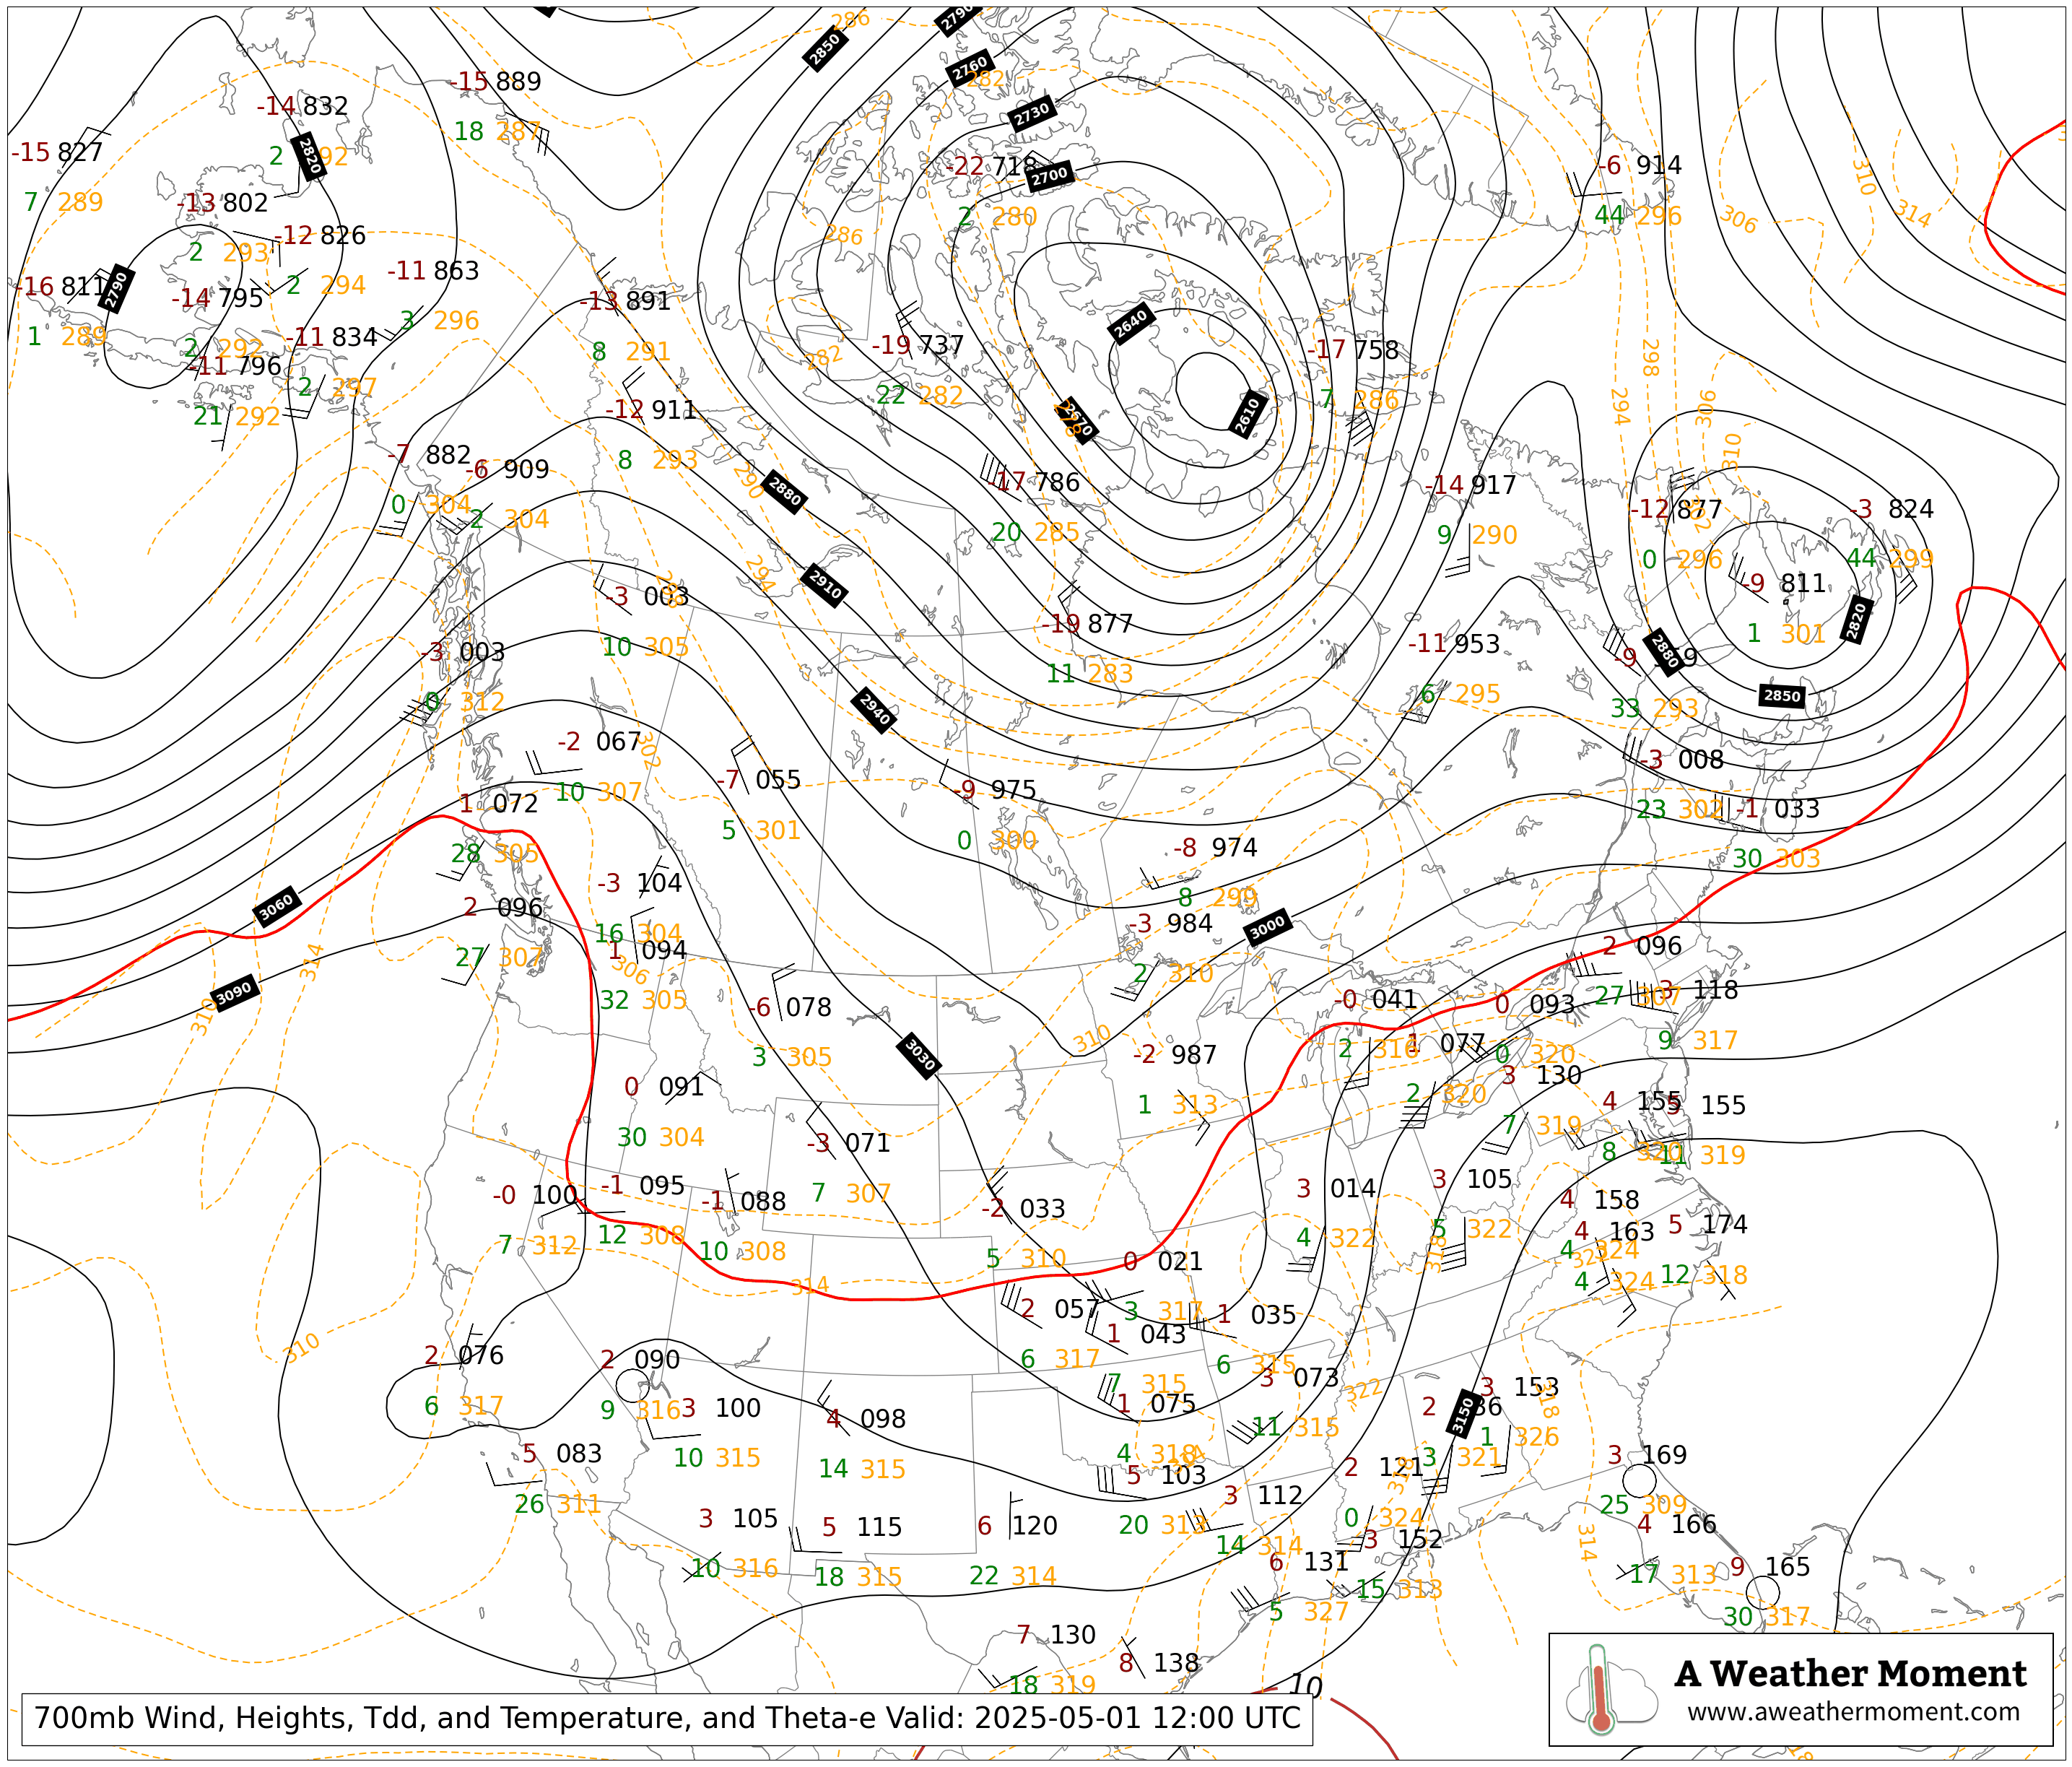
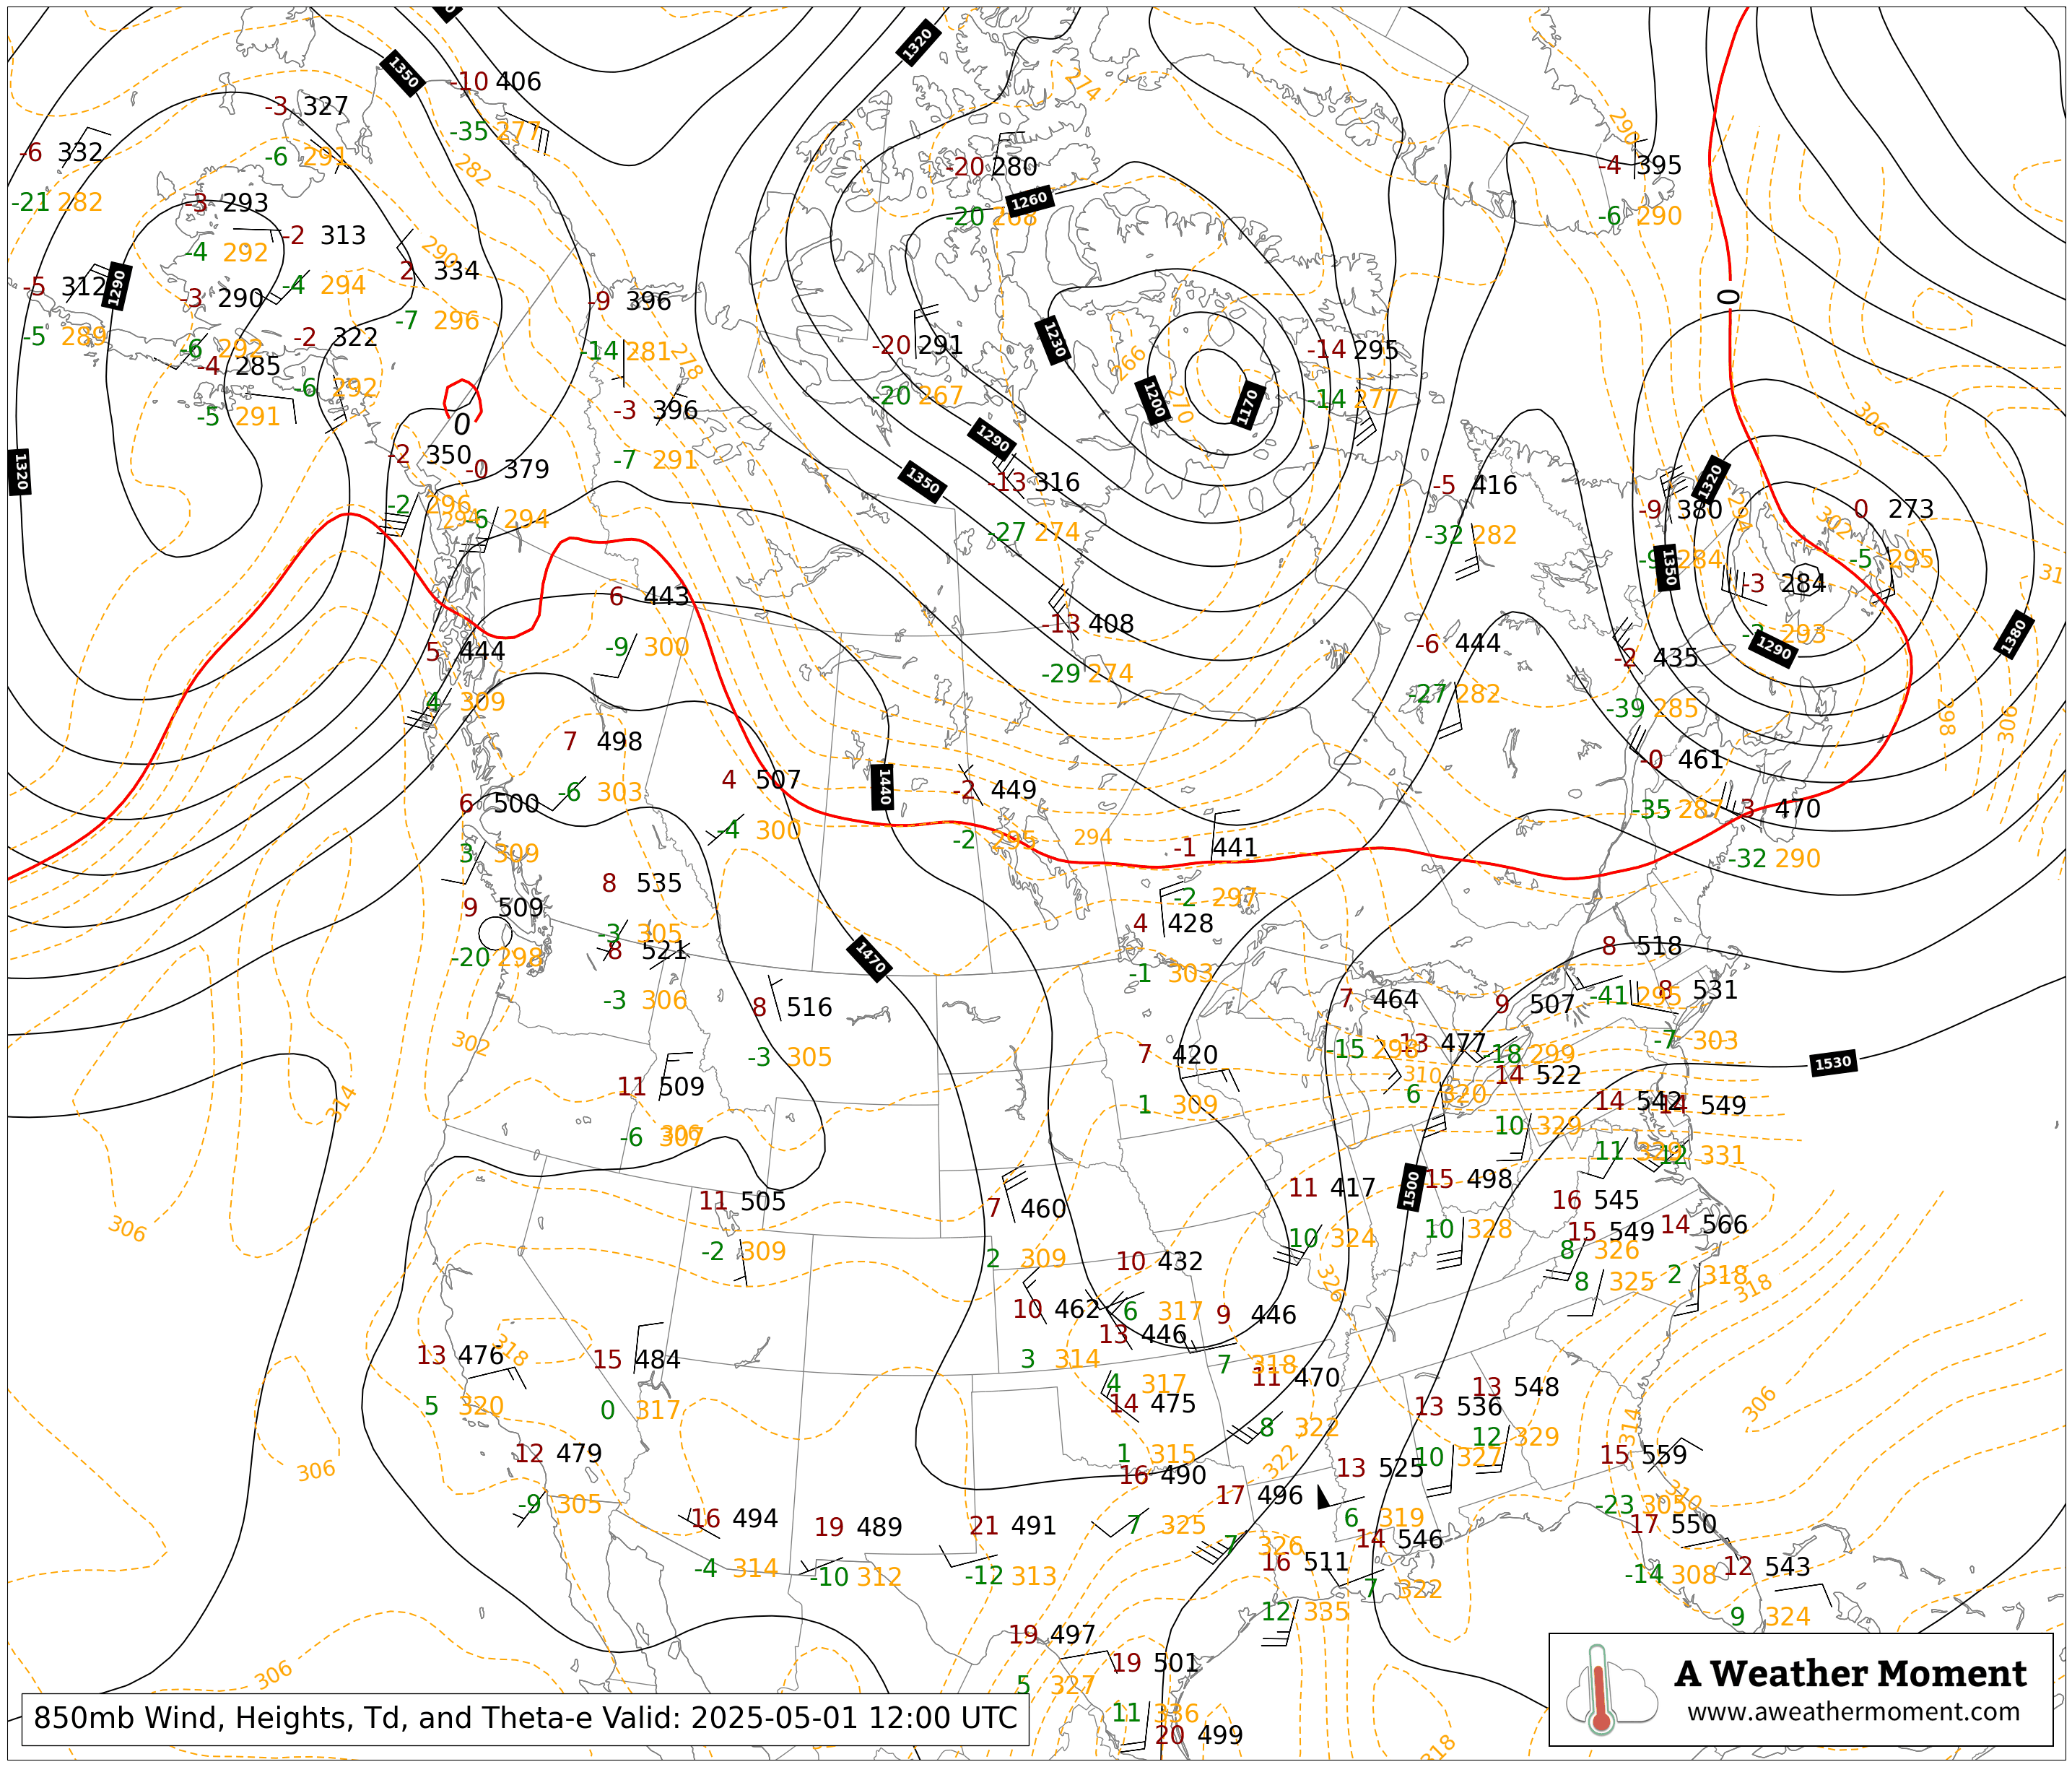
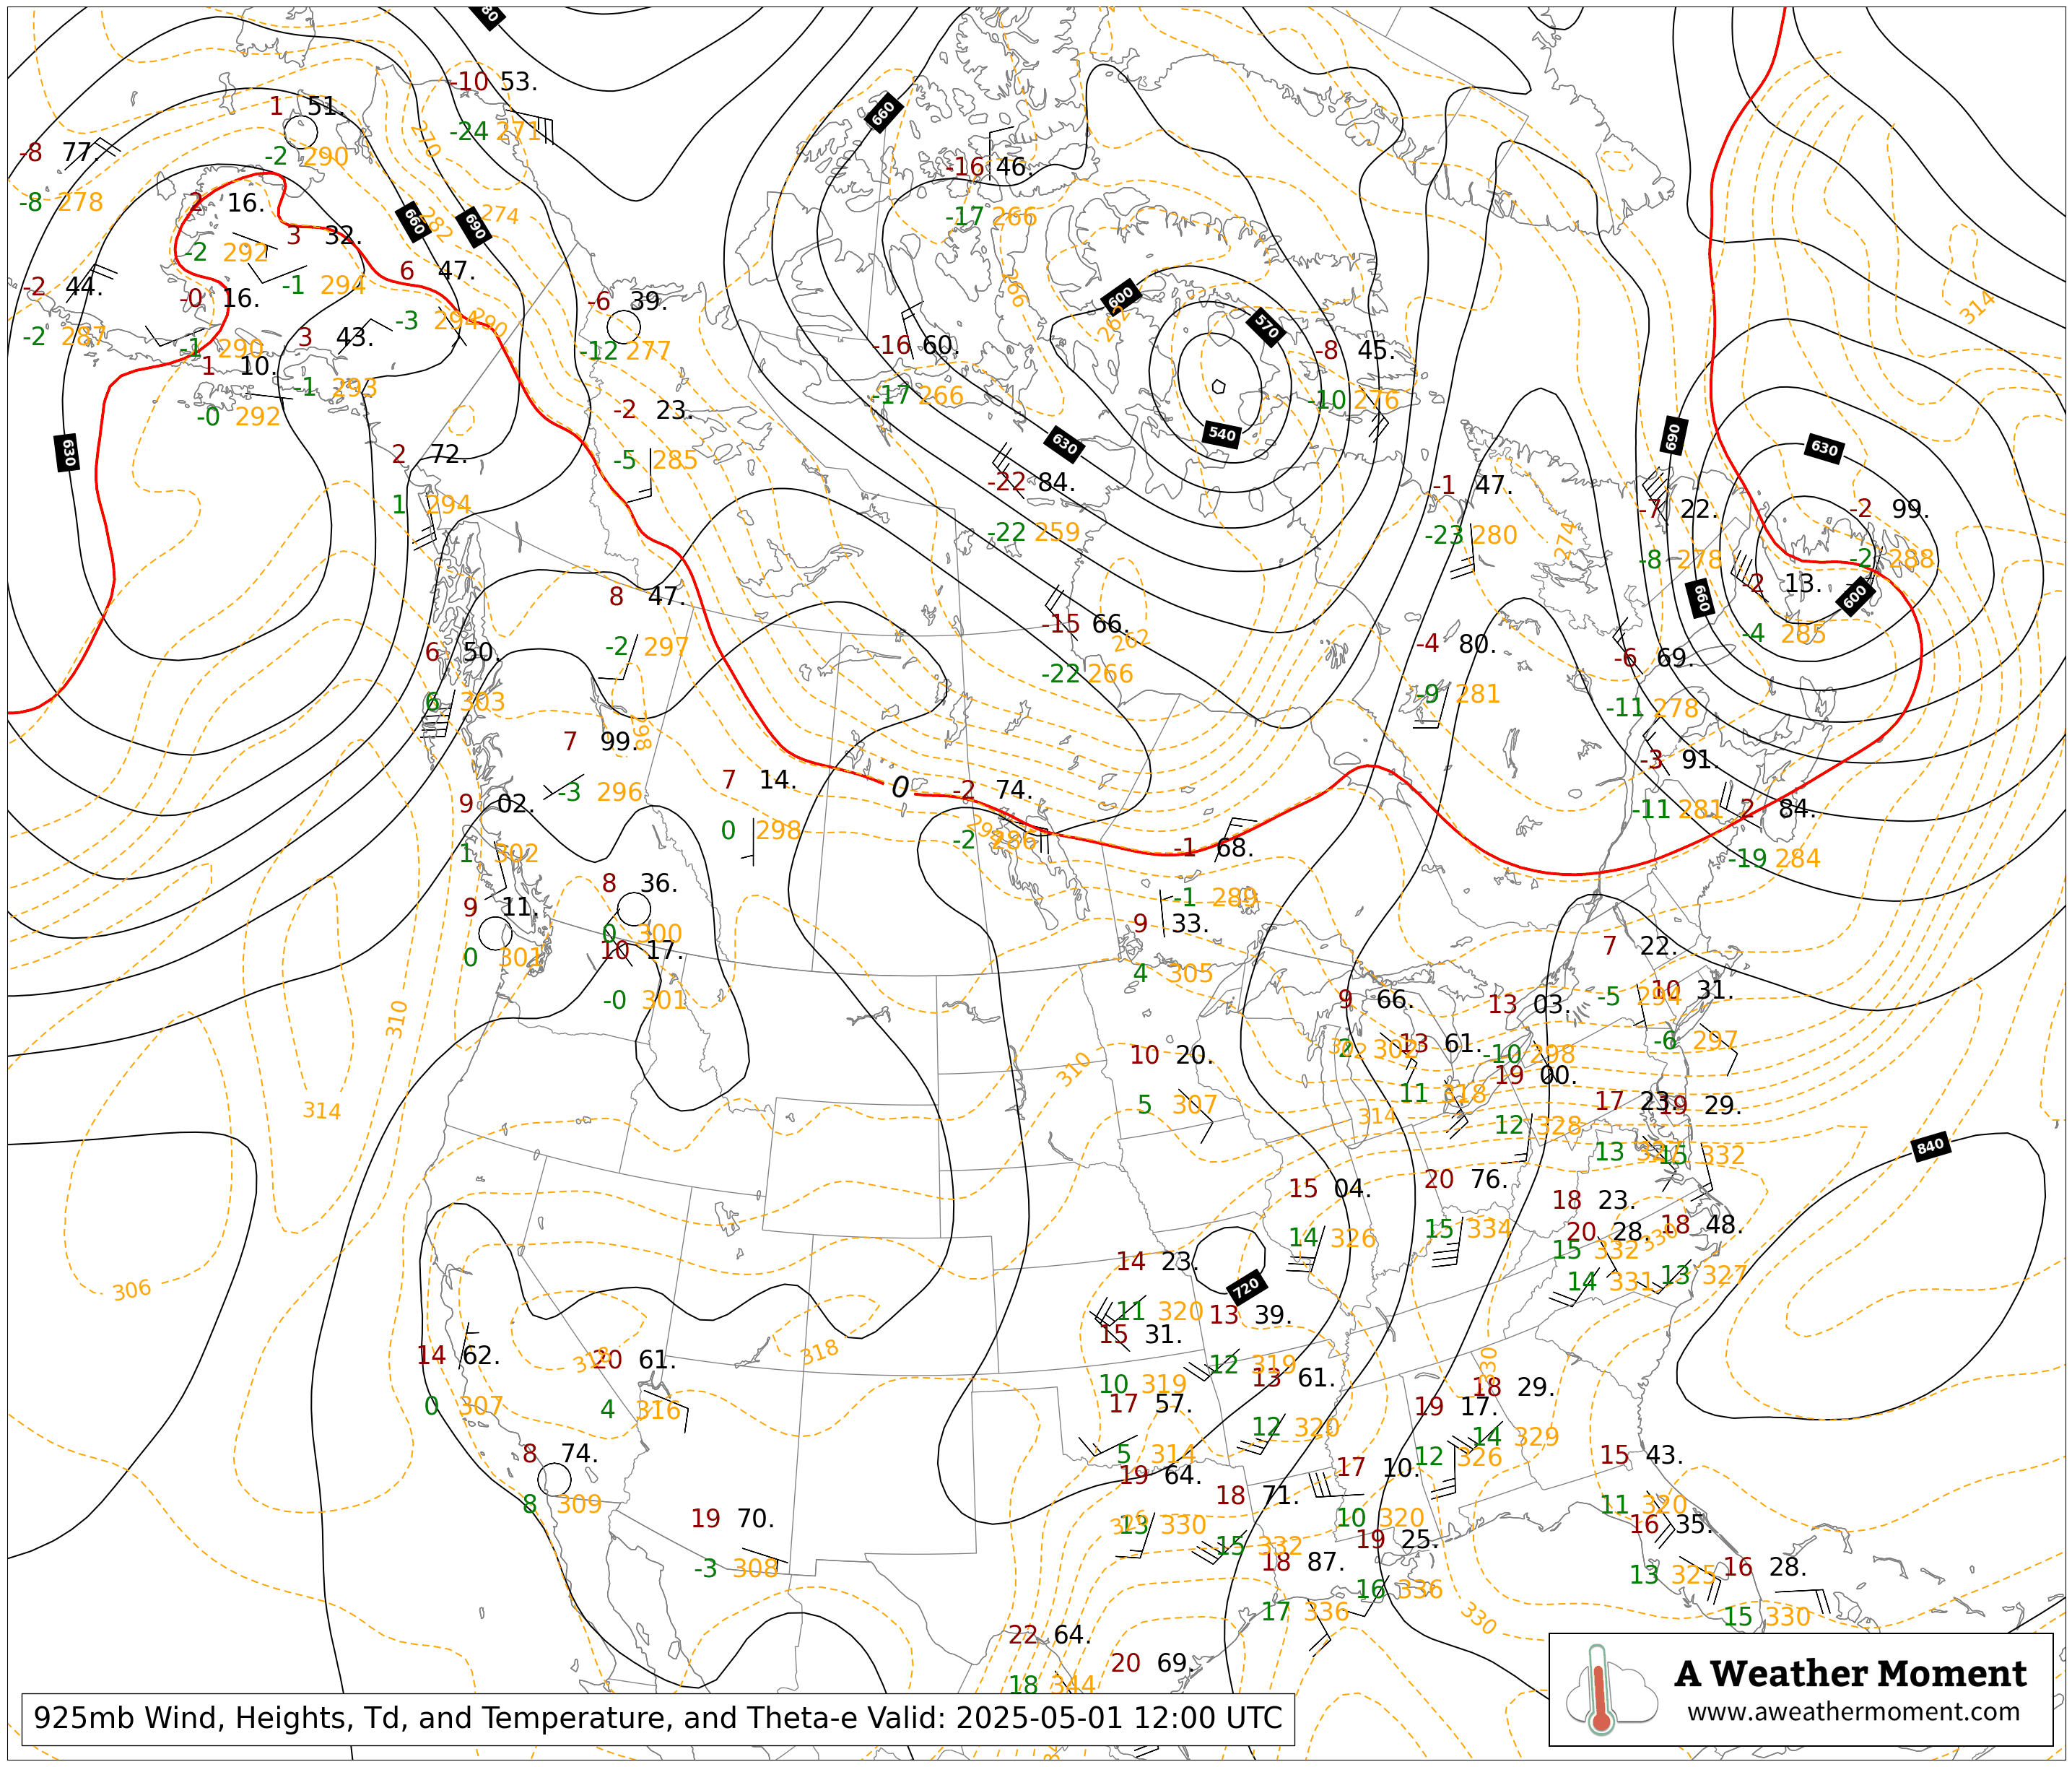
![](https://x-hv1.pivotalweather.com/maps/rtma_ru/latest/series_001/sfct-imp.us_nc.png)
![](https://x-hv1.pivotalweather.com/maps/rtma_ru/latest/series_001/sfctd-imp.us_nc.png)
Upper Air Plots
Latest map update: —
00Z Radiosonde Plots
12Z Radiosonde Plots
MeteoCentre Filled Plots
![](http://meteocentre.com/analysis/local/na_850.gif)
![](http://meteocentre.com/analysis/local/na_500.gif)
See also: SPC Charts | COD Charts
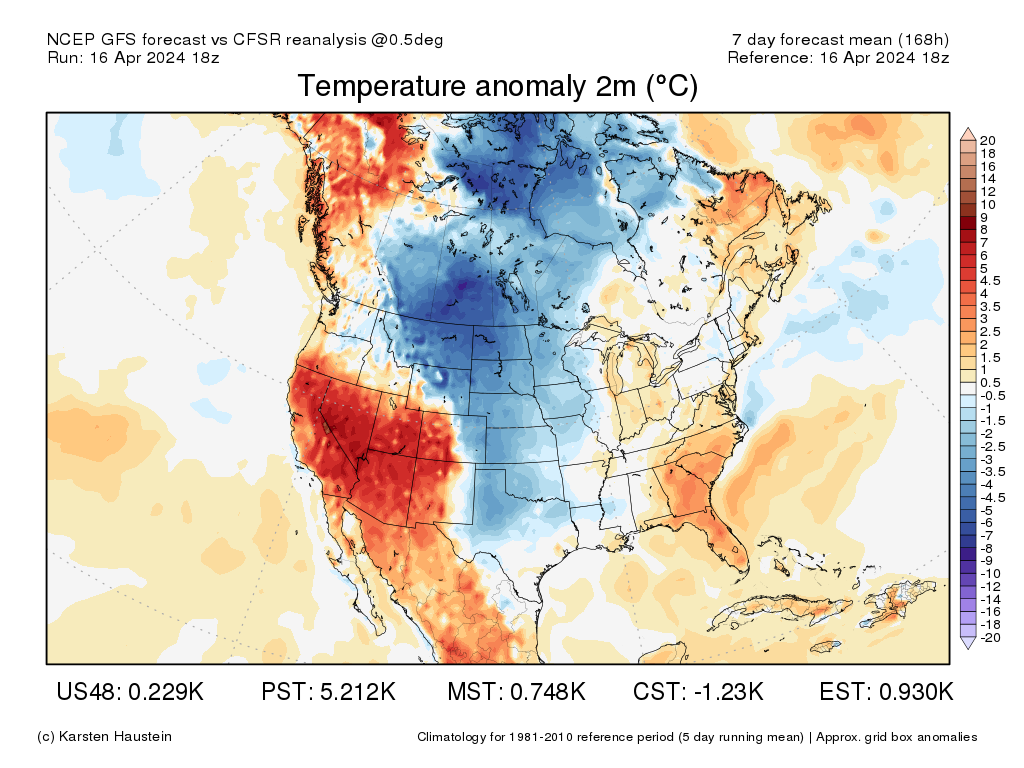
Long-Range Plots
7-Day Temperature Outlooks
CPC 6–10 Day Outlooks (Link)
CPC 8–14 Day Outlooks (Link)
See also: NAEFS 8–14 Day Ensemble