We’ll see some sun, some more snow, and temperatures all over the place as we see a wild weather pattern over the next few days.

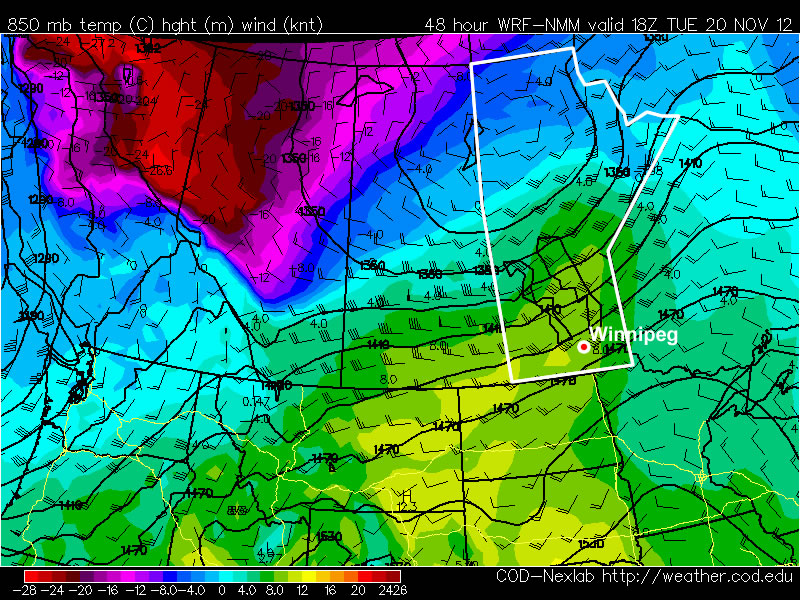
Sunshine will dominate today as a very strong Arctic high slumps through the Prairies. This high pressure system is a result of cold Arctic air pushing southwards behind a cold front that passed through yesterday. This will limit daytime highs today in the Red River Valley to only about -12°C. Temperatures will plummet towards -20°C tomorrow night as the ridge pushes through Southern Manitoba and breaks up remnant cloud left behind.
More cloud will begin pushing in late overnight into Saturday morning as another system tracks through the Northern Prairies. This system will warm things up a bit for us, bringing our daytime high on Saturday to a comparatively balmy temperature climbing just over -5°C. To go with those warmer temperatures will be some light snow with accumulations only around 2cm for much of the Red River Valley, including Winnipeg.
This system moves out on Saturday night, and we’ll move into a slightly more stable pattern. Sunday will likely be a mix of sun and cloud as we deal with a little bit of cloud left behind from Saturday’s system, with a high near -12°C again. As we head into next week, things look fairly steady with overnight lows near -15°C and daytime highs starting in the high minus teens and climbing into the low minus single digits.