Southern Manitoba 2013 Thunderstorm Season Statistics

Editor’s Note: The following is a guest post by @jjcwpg, originally posted here and has been updated with some relevant links from A Weather Moment.


July 13, 2013 southwestern Manitoba; most significant storm event of season; @lovestormsmb and I were there.

For the 4th consecutive year, I have gathered statistics on thunderstorm and severe thunderstorm frequency across southern Manitoba. An explanation of how I gathered these statistics as well as notes on accuracy can be viewed here. I have divided southern Manitoba into 6 regions: west, southwest, south, southeast, east and Interlake. These regions can be seen here. I understand the zones are not equal in size; I plan to try to improve this next year. Lastly, I’d like to thank you in advance for taking the time to read this post as it is one of my favourite posts of the year!

Number of days in 2013 thunderstorms were observed in each region.

The 2013 thunderstorm season was less active than in 2012 in all regions of southern Manitoba. The greatest decline in thunderstorm days was in the Interlake, southeast and east parts of Manitoba where in some cases there were more than 10 thunderstorm days less than in 2012. The Interlake saw the greatest decline, dropping from 67 thunderstorm days in 2012 to only 55 this year. In total, there were 89 thunderstorm days across southern Manitoba this year, compared with 109 last year.

One reason for the decline is because 2012 had a very long thunderstorm season, lasting from March to November. This year, the first thunderstorm did not occur until April 30, and the last on October 11 putting the season at 165 days long, compared with 237 days last year.

The season began quite late in some areas this year, in large part thanks to an incredibly late spring. The South, Interlake and East zones did not see their first thunderstorm until May 14, 2 months later than last year. On a more local scale, Winnipeg saw its first t-storm on June 10, the second latest start to the thunderstorm season since 1953.

Number of days in 2013 a severe thunderstorm warning was issued for each region.

Again in Winnipeg, there were only 17 thunderstorm days this year at the airport, tying for 4th least in a year since 1953. It just so happens that one of the years we tied with was 2011. This really follows the trend of the past few years of below normal thunderstorm activity in the city. The last time we had an above normal season was 2007. The last 6 years have averaged some 6 days below the 1981–2010 and 1971–2000 normal of 26 to 27 days.

In comparison, Brandon had 23 thunderstorm days this year, and I recorded 20 here in south St Vital.

The map to the left shows the number of days with a severe thunderstorm warning issued by Environment Canada in each warning zone. It appears southwestern Manitoba was the busiest this year for severe thunderstorms. The season in Manitoba lasted from June 9 to September 26, or 110 days, compared with 116 days last year. Click here for a map of the length of the severe thunderstorm season in each warning zone this year.

Number of days a tornado warning was issued in each region through 2013. Also plotted are confirmed and unconfirmed tornado events.

The last map I have is of tornadoes, as seen to the right. The colours in the warning boxes represent the number of tornado warning days this year, and the dots represent unconfirmed (possible or probable) and confirmed tornadoes (coloured by intensity). Only 4 tornadoes were confirmed, but many more may have touched down.

The most notable twister was in Sioux Valley, First Nation, west of Brandon on July 18. It was a strong EF–0 tornado, and moved right through town, destroying a few homes and leaving a few injured. Other than that, the most significant potential tornado event was in the Pipestone to Hartney area on July 13. Significant damage occurred in the area, including to the arena in Pipestone which half of it had been flattened. It is still up in the air wether a tornado occurred or not. Either way, according to Discover Westman, some recall the storm as being the worst storm in recent memory in southwestern Manitoba.

The storm also only worsened the flooding conditions in Reston, which saw yet another round of biblical rains with the storms. In fact, the town had received about 352 mm of rainfall in just a 24 day period from June 20 to July 13 according to Manitoba Agriculture.

In addition to the rains and winds, 9 cm diameter hail was measured in southeastern Saskatchewan with the storms.

Lastly, the following graph summarizes the number of thunderstorm days, severe t-storm warning days and tornado warning days across all of southern Manitoba per month:

Summary of all thunderstorm statistics for all of Southern Manitoba broken out by month.

Thanks for reading! A summary of the severe storm season across Canada will come late next week.

Beautiful Weather Ahead; Summary of 2013 So Far

We’ll see a beautiful second half to the week as an upper ridge continues to dominate the Eastern Prairies bringing more heat and humidity to Southern Manitoba with daytime highs climbing to (or just over) 30°C.

Wednesday

31°C / 19°C
Mainly sunny.
Thursday

30°C / 18°C
Mainly Sunny. Becoming humid.
Friday

30°C / 18°C
Mix of sun and clouds. Humid. Risk of showers or thunderstorms.

The next couple days will bring mainly sunny skies with highs just over 30°C. Winds will remain fairly light and comfortable dew points will make for perfect summer weather. By Thursday afternoon, dew points will begin to climb ahead of an approaching trough line making things start to feel a little sticky.

On Friday, we’ll see continued hot weather however the upper ridge will have moved off and we’ll see a trough line pushing across Southern Manitoba. Depending on how things develop on Thursday night in Saskatchewan, we may see a few dying showers or thundershowers on Friday morning, but the main threat for any storm activity should hold off until the afternoon. Moisture pooling along the trough will push the dew points towards 20°C, making it feel very humid and closer to 37 or 38°C than the high of 30°C. There’s a decent chance we’ll see some thunderstorms on Friday afternoon develop along the trough line, a few of which may be able to become severe. MLCAPE values from 800–1000J/kg are fairly low, however SBCAPE values look to sit between 1500–2000J/kg; if a storm is able to get organized enough to really tap the surface moisture the main threats would likely be heavy rain given the ample moisture available coupled with fairly weak bulk shear and slow storm motion. We’ll have a more comprehensive look at the severe weather threat for Friday in the next blog post. Enjoy that summer weather!

A Look at 2013 So Far

We’ve made it half-way through 2013! This year has started in sharp contrast to last year where unprecedented heat swept over North America very early in the year, leading to a record-breaking start to spring and summer that fast-tracked 2012 to one of the top–5 hottest years ever for Winnipeg. 2013 has seen a painfully slow start to the summer weather as the icy grip of winter hung on for an inordinately long time leading to one of the latest snow melt dates ever record in the Red River Valley.

2013 Monthly Temperatures

Monthly average temperatures from the Winnipeg Richardson International Airport for 2013. The dashed line represents the 1981–2010 average.

Looking at monthly average temperatures, perhaps most interesting is how “normal” this year actually has been. January and February ended up almost perfectly seasonal, as have May and June. March and April, however, clearly show the impact of the prolonged cold and snow pack. April finished with a monthly average temperature of –2.1°C which was 6.6°C below normal and a whopping 7.9°C below 2012.

Jan Feb Mar Apr May Jun
2012 –10.8 –9.8 2.2 5.8 12.2 17.7
2013 –16.7 –14.0 –8.0 –2.1 11.1 17.5
Average –16.4 –13.5 –5.8 4.5 11.4 16.9
Table of average monthly temperatures from the Winnipeg Richardson International Airport for 2013. Temperatures are in °C. Average is for the period 1981-2010.

Looking at the year-to-date average temperature, things look about as we would expect. We started off near-seasonal with things falling a little below-normal through our cold spell in the spring which has been maintained as we’ve seen temperatures climbing back to seasonal with no above-seasonal weather. We’re a good deal cooler so far than last year, but that’s expected given the start we had in 2012.

2013 YTD Average Temperature

Year-to-date average temperatures from the Winnipeg Richardson International Airport for 2013. The dashed line represents the 1981–2010 average.

Despite the spring that would never end, this year is shaping up to be surprisingly seasonal! The 30°C weather recently is certainly helping me forget the snow that stuck around for so long…

Jan Feb Mar Apr May Jun
2012 –10.8 –10.3 –6.1 –3.2 –0.1 2.9
2013 –16.7 –15.3 –12.9 –10.2 –5.9 –2.0
Average –16.4 –14.9 –11.9 –7.8 –4.0 –0.5
Table of year-to-date average temperatures from the Winnipeg Richardson International Airport for 2013. Temperatures are in °C. Average is for the period 1981-2010.

Precipitation so far this year at the airport has been near-normal and slightly less than last year. I’d just like to make a comment that this spring/summer, especially over the past month, has been extremely wet of portions of the Red River Valley. This season has had an abnormally high number of slow-moving thunderstorms that has locally produced huge amounts of rainfall. Even here in Winnipeg, once some stations from other areas of the city are included, amounts of precipitation so far this year has varied by almost 8 inches!

2013 YTD Precipitation for Winnipeg

Table of year-to-date precipitation from the Winnipeg Richardson International Airport & Rob’s Obs unofficial observing site in Charleswood for 2013. Average is for the period 1981–2010.

The observations from Rob’s Obs include two significant precipitation events that only part of the city saw: the first is a back building thunderstorm that brought over 75mm of rain to the southwest portion of the city as well as multiple showers that passed over western portions of the city last week that gave another 20mm of rain to that area. As can easily be seen, while the airport is sitting at near-normal amounts of precipitation, some areas of the city are approaching twice the normal yearly amount. For some other areas in Manitoba, such as areas near Reston, MB, they’ve already received an entire year’s worth of rain over the past month, and that’s on top of the precipitation that’s fallen earlier this year. It’s been very wet in general over Southern Manitoba so far this year. Here’s the year-to-date precipitation values:

Jan Feb Mar Apr May Jun
2012 12.0 16.5 63.0 102.0 200.0 262.0
2013 30.0 38.0 57.0 90.5 159.5 222.3
2013
Rob’s Obs
3.0 8.6 24.8 66.9 185.6 441.6
Average 19.1 33.6 59.0 89.1 149.0 237.8
Year-to-date precipitaiton from the Winnipeg Richardson International Airport & a Charleswood observation site for 2013. Precipitation amounts are in mm. The dashed line represents the 1981-2010 average.

It will be interesting to see how the remainder of the year plays out. While 2012 started off very warm, we actually had below-normal temperatures in the second half of the year that brought us closer to seasonal – although it was still an exceptionally warm year – than it originally seemed that we would. We’ve had a cold start to the year, but we seem to finally be getting into the swing of summer and plenty of hot weather seems to be in the future as long-range models continue to support/sustain a large ridge over the Rockies.

August Continues Winnipeg’s Heat Streak

August closed out with another 30°C+ day, rounding out what ended up being another above-seasonal month, continuing Winnipeg’s above normal temperature streak to 14 consecutive months.

August 2012 Summary

2012 Departure from Normal Temperature, with Year-to-Date mean

2012 departure from normal (or monthly anomaly of) temperature. The year-to-date mean is also plotted.

August 2012 closed out with an average temperature of 19.2°C, 0.51°C above the normal of 18.7°C. At +0.51°C above normal, the month of August ended as the closest-to-normal month so far this year; the next closest was May which ended at 0.8°C above normal. The warmest day in August 2012 occurred on August 29th, where the mercury soared to 35.4°C, just shy of that day’s record of 36.1°C set in 1972. No new daily record high temperatures were set this August. The coldest night this August was on the night of August 18/19th where the temperature dipped all the way down to a chilly 4.5°C. This was well above August’s record low temperature of –1.1°C set in 1888. New new daily record low temperatures were set this August.

2012 Departure from Normal Precipitation, with Year-to-Date total

2012 departure from normal (or monthly anomaly of) precipitation. The year-to-date total is also plotted.

August ended with a significant deficit of precipitation compared to normal. Usually we see close to 80mm[1] of precipitation, however this month we saw just 44mm. This continues the Winnipeg’s precipitation deficit to 3 consecutive months.

In other miscellaneous August statistics:

  • We finished the month with 6 days at or above 30°C.
  • August 2012 ended up as only the 45th warmest August on record.
  • The greatest precipitation event this august was 23mm on August 4.
  • This month’s precipitation accumulation of 44mm pales in comparison to the record wettest August that occurred in 1985, where Winnipeg received a whopping 218mm of rain.
  • We quadrupled the record driest August’s (1915) total precipitation amount of 10mm.

2012 So Far

As mentioned before, August’s deviation from normal temperature of 0.51°C has continued the above normal trend for 2012. Every single month this year has been above normal temperature-wise and August marks the 14th consecutive month of such weather.

September 1st marks the start of meteorological fall, so we can take a quick look at Summer[2] 2012. Temperature-wise, we ended up as the 14th warmest summer, although it was an extremely close race…

Top 15 Warmest Summers on Record
Year Average Summer
Temperature
1 1988 21.0°C
2 1983 20.6°C
3 1961 20.4°C
4 1955 20.2°C
5/6 1930 20.1°C
5/6 1963 20.1°C
7/8 1933 19.9°C
7/8 1995 19.9°C
9 1991 19.87°C
10/11/12 1919 19.83°C
10/11/12 1921 19.83°C
10/11/12 2006 19.83°C
13 1936 19.767°C
14 2012 19.761°C
15 1932 19.7°C

If you round to tenths, then there is a 5-way tie for 10th place, however looking closer, we can see the finer details and sort things out.

Year-to-Date Temperature Anomalies for Winnipeg, MB

Year-to-date temperature anomaly, by month, for 2012 (red) compared to the other 139 years on record for Winnipeg, MB, with the five warmest years (orange) and five coldest years (blue) noted.

Looking again at our Winnipeg temperature anomaly climatology, we’ve added in August of this year, and we can now see that we are the most above normal that we’ve ever been. While we were chasing 1987 last month, with August’s +0.51°C temperature anomaly we’re now 0.25°C above 1987’s August YTD anomaly. At this point, it’s pretty much guaranteed that 2012 will end upon the top 5 hottest years on record, it’s just a matter of where exactly we end up.

June, July and August all had below-normal amounts of precipitation which has left us with a 118mm deficit for the summer months. Typical summer rainfall is 247.5mm, which puts this summer at only 52% the normal amount of precipitation. This is a troubling trend; 2011 placed as the 5th driest summer on record, and 2012 managed to sneak into the top 10:

Top 10 Driest Summers on Record
Year Summer Rainfall
1 1929 76.7mm
2 1886 77.2mm
3 1961 91.0mm
4 2006 91.5mm
5 2011 93.0mm
5 1889 96.0mm
7 1894 97.1mm
8 1915 114.8mm
9 1936 121.4mm
10 2012 129.5mm

Due to our wet spring, however, we’re “only” 67mm below our normal precipitation amounts on the year so far.

The Rest of 2012

While seasonal forecast have very little skill, there are a few things that can give us an idea of how the rest of the year is going to shape up. With Arctic sea ice at a record low, it will take longer than normal to establish a pool of cold Arctic air. In particular, the delayed onset of ice over Hudson Bay can inhibit the development of a true Arctic vortex over the area. This feature sets up a strong NW flow over the NWT and eastern Prairies and is often responsible for the advection of Arctic air southwards into the Prairies and Northern Plains. The inhibition or absence of this feature means that, while cold outbreaks can never be ruled out, it’ll be much more difficult for the cold air to actually stick around.

Another feature to keep an eye on is El Niño, the feature responsible for bringing warmer waters to the eastern equatorial Pacific. When El Niño is weak, it’s effects can be limited to areas further west in the Prairies[3], however in moderate-to-strong El Niño events, Southern Manitoba will often see warmer-than-normal winters. In weak-to-moderate events, precipitation can be increased over the region as the storm track cuts through the area, but in stronger events, the storm track is often to our north and Winnipeg enjoys relatively warm, dry winters in a bit of a no-man’s-land in the middle of a strong split upper flow.

That being said, it’s quite likely that the onset of winter will be delayed due to the delay in development of a pool of cold Arctic air, and it’s all but guaranteed that 2012 will go down as one of Winnipeg’s warmest years on record.


  1. August’s 1981–2010 normal precipitation amount is 79.4mm.  ↩
  2. Meteorological summer runs through June, July and August.  ↩
  3. British Columbia and Alberta, mainly. Saskatchewan marginally.  ↩

What Happened To Winter?

Winnipeg has been enjoy a wonderful winter, quite a surprise given that a lot of forecasts had called for colder than normal temperatures, a common occurance when La Nina is in full swing. This winter has been stellar so far, but just how warm has it been? Lets take a closer look, and then a special announcement!

For full disclosure, I’m using numbers from January 1981 to now from the Winnipeg Richardson Int’l Airport (1981-2007) and the Winnipeg Richardson AWOS (2007-Current). The numbers are gathered from the daily summary provided on the Weather Office Climate Archive site. The data used is “current” to January 25, 2012.

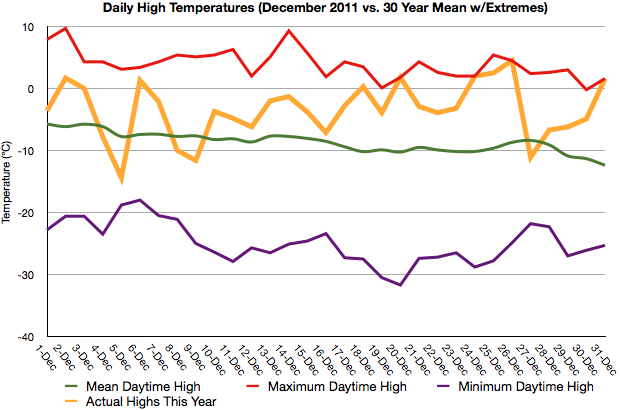
Looking first at daytime highs. We know that December was well above normal, as was the start to January. How much above normal?

December 2011 Temperatures vs. Climatology

December 2011 daytime highs compared to 30 year means. Maximum and minimum extrema included (these are the warmest and coolest daytime highs for those days in the last 30 years).

We can see that this year (yellow bold line), much of December was spent above our average daytime high. In fact, 84% of the days in December had daytime highs above normal, with a streak of 17 days with above normal temperatures. We were, on the days we were above normal, on average 10°C above our normal daytime highs for each respective day in December.

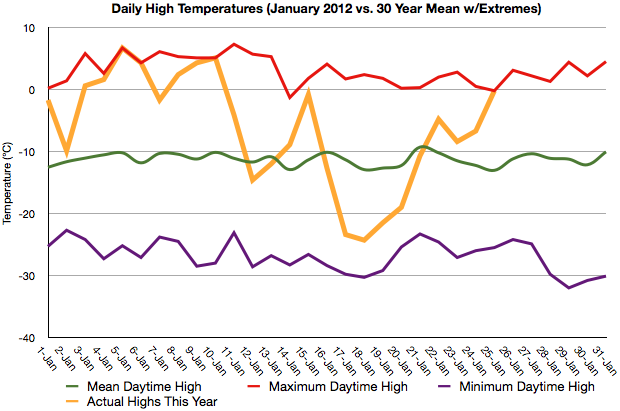
January 2012 Temperatures vs. Climatology

January 2012 daytime highs compared to 30 year means. Maximum and minimum extrema included (these are the warmest and coolest daytime highs for those days in the last 30 years).

So far this January, we’ve been off to a great start as well, with 71% of our days above normal for daytime highs, which isn’t bad for having quite a cold snap in the middle of the month. We had a nice streak at the beginning of the month with 11 days in a row with above normal temperatures. On the days this month that we’ve been above our normal temperatures, we’ve been, on average, 6.5°C above normal for each respective day in January.

So the days have been warm. This only tells half the story, however. An interesting story emerges when we look at overnight lows…

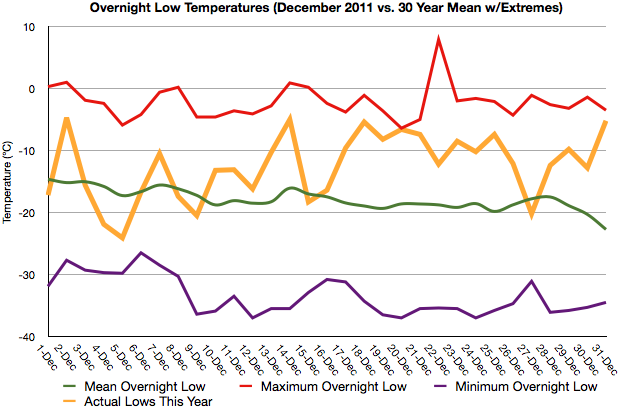
December 2011 Temperatures vs. Climatology

December 2011 overnight lows compared to 30 year means. Maximum and minimum extrema included (these are the warmest and coolest overnight lows for those days in the last 30 years).

When we look at December of this winter, we see a compelling argument unfold. 23 nights (74%) of the monthhad temperatures, on average, 8.4°C above normal. We had 11 nights in a row with overnight lows above normal by as much as 13.5°C! And January is an equally compelling story…

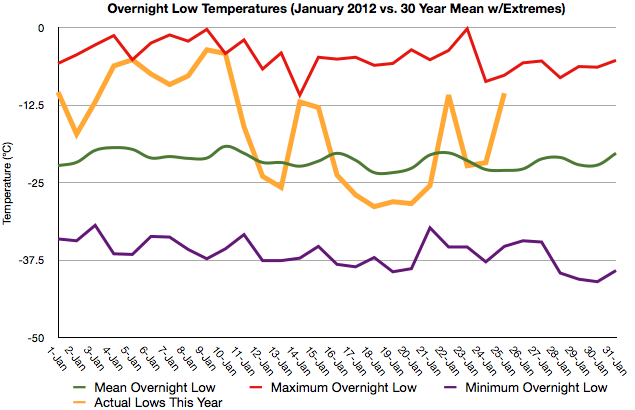
January 2012 Temperatures vs. Climatology

January 2012 overnight lows compared to 30 year means. Maximum and minimum extrema included (these are the warmest and coolest overnight lows for those days in the last 30 years).

This month, we’ve spent 16 nights with above normal temperatures (65% of the month), which have been 10.6°C above normal on average. We had a wondeful streak of 11 nights at the beginning of the month with above normal overnight lows, including January 9th, whose overnight low was a whopping 17.5°C above the 30-year mean.

So not only have we been nowhere close to as cold as it can be, we haven’t even really spent any signifigant time being anywhere near as cold as we ought to be! But there’s one way to make this even more succinct…

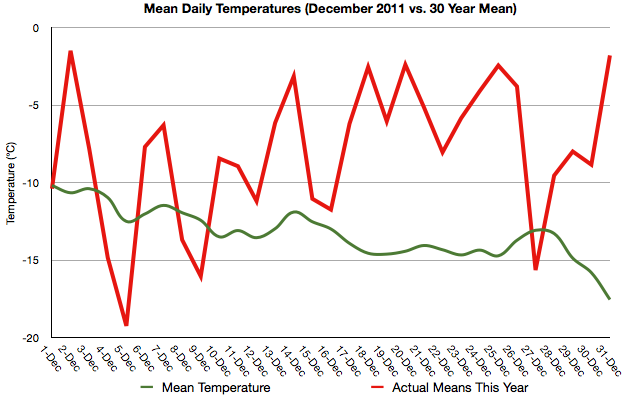
December 2011 Means vs. Climatology

December 2011 mean temperatures compared to 30 year means.

What I’ve done here is a crude approximation of the mean daily temperature. While it would be nice to properly integrate the hourly observations to calculate a true time-weighted mean temperature for each day, I have weather stripping to install, shelves to build, and many other things that would also like my time. So I’ve done a quick average of each day’s maximum and minimum temperatures ( [Max + Min]/2 ). I’ve calculated the 30 year mean by taking the mean of the mean daily temperatures.

What this shows us is a “combined” look at how much warmer the entire day was, instead of singular values. We can see that once we shifted into a warmer patter around the 10th of December, we cruised without looking back. A total of 26 days (84% of the month) above the normal mean daily temperature, with many days as high as 10-15°C above normal. We had 17 days in a row with above normal temperatures in December, and for all the days above normal, we were on average 6.9°C warmer.

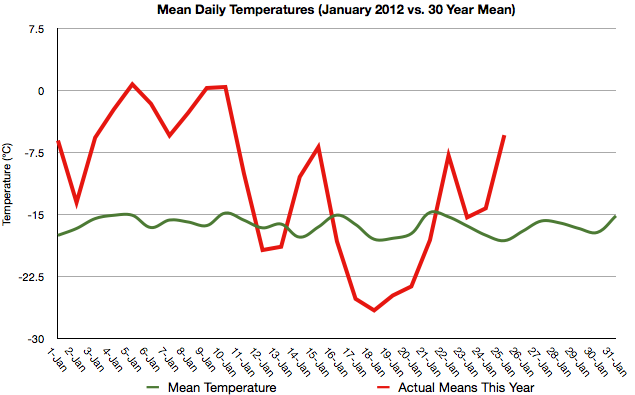
December 2011 Means vs. Climatology

January 2012 mean temperatures compared to 30 year means.

January tells a similar story with 17 days so far above normal, on average by 10°C! What these mean values tell us is that not only have our days been warm this winter, but the entire 24-hour cycle has been significantly wamer than normal as well. Save for one day, we were above normal in hour temperatures from December 10th to January 11th, 32 days in a row. We spent a month with temperatures 6-10°C above normal on average, with many days near or warmer than 0°C during a time of the year when it’s not uncommon to be hiding inside while it’s -35°C outside! What a winter indeed!

And with ensembles predicting above normal temperatures into the middle of February, our odds of getting an entrenched arctic deep freeze in Winnipeg are starting to look mighty, mighty slim. Something I’m sure not too many people will complain about.


And Now For Something Different…

So, what if you want to make your own temperature forecast? Or precipitation forecast? What if you need to make your own decision on whether or not you should take your sailboat out on the South Basin tomorrow?

Fortunately for the public, most government agencies make their model data freely available for use. Getting at it can be difficult and time-consuming though. Everybody has their own tools for viewing data; often they are bulky and slow server-side PHP solutions. That jargon means that it’s not very fast and you spend a lot of time waiting for pages to reload.

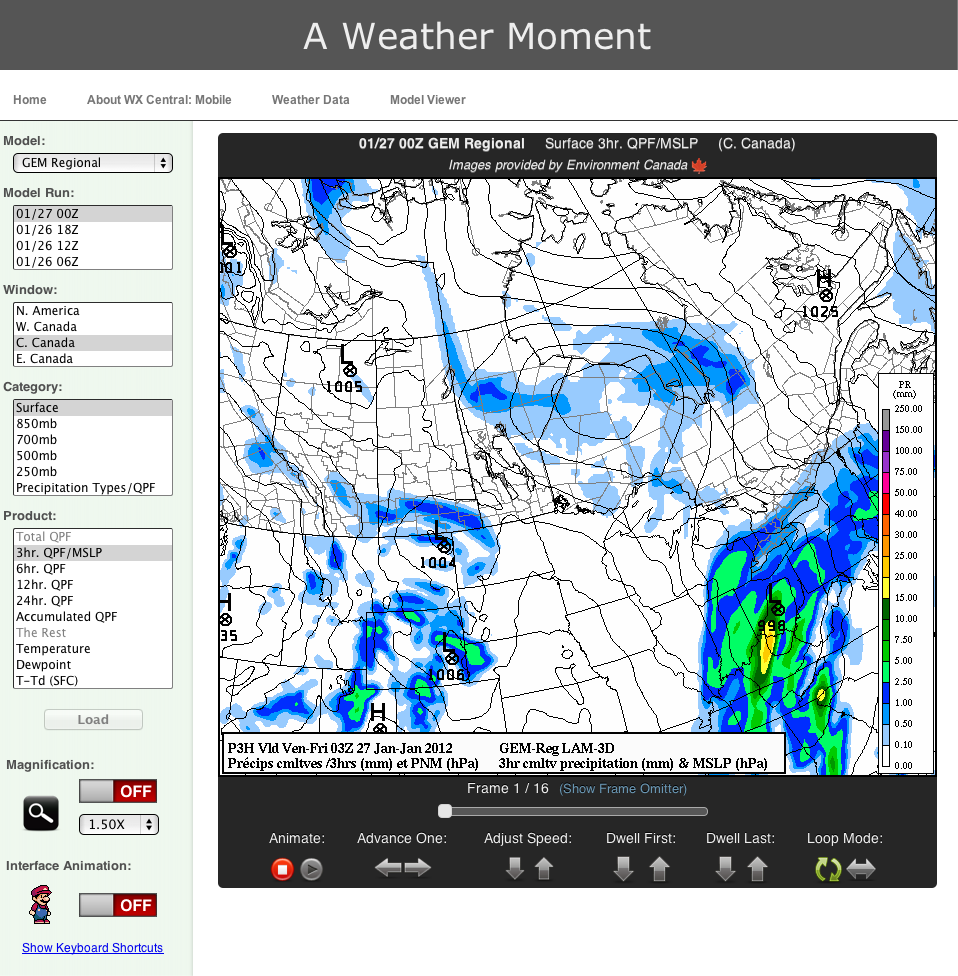
Well, it doesn’t have to be that way! A Weather Moment is excited to introduce our model viewer! We’ve built a comprehensive tool that lets you view model data from several models, including Environment Canada’s GEM-Regional and GEM-Global models, the NWS NAM and GFS models, as well as the UKMET model and ECMWF. Over time, we plan on adding more publically accessible data to the viewer.

A Weather Moment Presents the Model Viewer

A Weather Moment Presents the Model Viewer!

You can easily switch models and load new products without ever having to refresh the page. We have convenient keyboard shortcuts to control everything from animation to mangification to removing frames from the loop or jumping back to the beginning or end. Our Frame Omitter gives you the control to view exactly the images you want. All of this is part of a lightning-fast backbone that lets you view model data quicker than anywhere else on the internet.

We are providing this to let you begin to see what goes into making a forecast. Please note that model data is not the “answer” to the weather. It is a computer’s opinion, and is wrong just as often as anyone else is. It can be very helpful guidance, and can often give you a good idea of what to expect.

We hope that this tool can help anybody who views our site access weather forecasting information quickly and easily! The only limitation is that, unfortunately, the viewer does not currently support Internet Explorer. There are a lot of technical reasons for this, but ultimately it’s because I’ve coded the tool to W3C standards for optimal compatibility, and Internet Explorer does not yet conform to those standards. The tool may or may not render and/or operate correctly on any version of Internet Explorer. Any other browser will work great, though (e.g. Mozilla Firefox, Google Chrome, Apple’s Safari). You can check it out by hitting the Model Viewer link at the top menu of the site, so go check it out!