Elsewhere in Weather News: March 8th, 2014

Cyclone Takes Aim at Northern Queensland

On Thursday, March 7th an area of convection appeared off the northern coast of Australia in the Arafura Sea, associated with a weak tropical disturbance. Since then the convection has remained nearly stationary due to steering winds being fairly weak but not much organization has occurred. However, the disturbed area is expected to organize quickly today into tomorrow as it drifts slightly to the southeast where shear values are low and sea surface temperatures are very warm; 30-31°C. By Sunday evening it is expected that Gillian become a category two cyclone, just off the northern coast of Queensland.
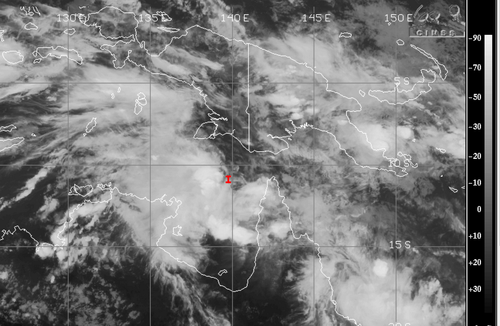
Infrared satellite image of Gillian looking rather disorganized, but with some deep convection on Friday evening. (Source: CIMSS)

The Australian Bureau of Meteorology (BoM) warns that winds could approach 150km/h in areas closest to where it makes landfall. Shoreline areas are most at risk along the peninsula due to the storm surge and large waves. Flooding/flash flooding is also expected as areas along the coast have received around 850mm in February; over double their average rainfall for that month. Another 250-400mm could fall in the region due to Gillian. It is expected that Gillian linger through the beginning of next week and die out as it continues south over land.

Queensland's rainfall for the past 30 days, note the area of 800+mm, this is where Gillian is headed. (Source:BoM)
Queensland’s rainfall for the past 30 days, note the area of 800+mm, this is where Gillian is headed. (Source:BoM)

Interestingly enough a second, weaker, cyclone is spinning off the east coast of Queensland and is expected to make landfall at about the same time that Gillian does as a strong category one. Both cyclones are to watch Sunday into the beginning of next week as they pose a threat to the northern and eastern areas of Queensland. The Australian cyclone season begins November 1st and ends April 30th and on average they see about ten cyclones per year.
Elsewhere in Weather News: March 1st, 2014

Australian Town Sees Flooding Rains

The town of Dajarra, a small Australian town in the northwestern part of Queensland, has faced flooding problems that started mid-week and worsened Thursday. The flooding was associated with a surface trough of low pressure that stayed nearly stationary for over 24 hours and sparked slow moving convection. General reports of 60-80mm in the region were reported but some localized amounts reached as high as 150mm. In addition, the region has been drought-stricken in the past few months which makes it tougher for water to infiltrate soils and easier to runoff.

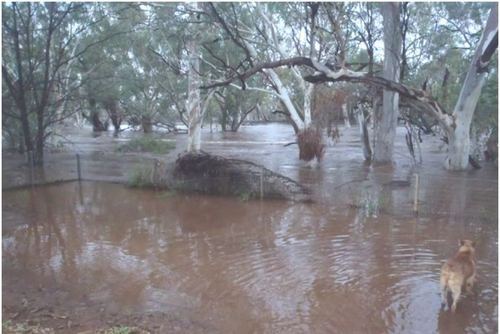
Wills River overflows its banks in Dajarra. (Source: ABC)

The result of all this rain was that creeks overflowed their banks and quickly turned into raging rivers. Most residents were evacuated as homes were threatened or were inundated by the floodwaters. Some workers from the railway were also stranded but have since been saved from the waters. The town is still cut off due to floodwaters as of Friday evening.

Dajarra’s average rainfall for the whole month of February is 100mm but they have received over 125% of this in the past week. It appears as though the surface trough will linger until the end of this weekend and continue to bring unsettled weather. This event comes two weeks after the flooding that occurred in Adelaide, South Australia, which wreaked havoc on the city. In one day 73mm of rain was dumped on Adelaide making it the most rain the city had received on a single day in February since 1969.

Elsewhere in Weather News: January 25th, 2014

Flooding Problems Return to Philippines

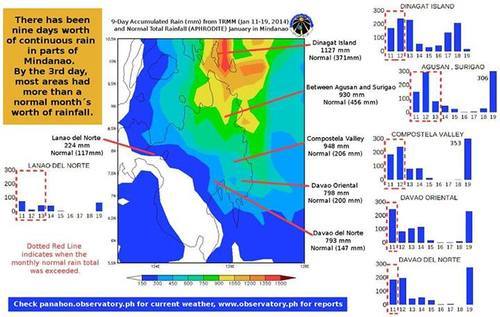
It has been just over two months since typhoon Haiyan ravaged the Philippines and yet another tropical system has swept across the Philippines this past week to cause problems. Agaton, which was only rated a tropical depression bearing winds of 55km/h, was very slow-moving at only 5km/h towards the west. This was mainly due to high pressure to its west-northwest blocking its movement. In turn, severe flooding and landslides over the mountainous terrain was possible as the storm churned over land and was able to drop large amounts of rain at the same time.


The Manila Observatory posted a compilation of rainfall amounts between January 10th to 19th in the Mindanao region. (Source: Manila Observatory)
The Manila Observatory posted a compilation of rainfall amounts between January 10th to 19th in the Mindanao region. Click on image to enlarge. (Source: Manila Observatory)

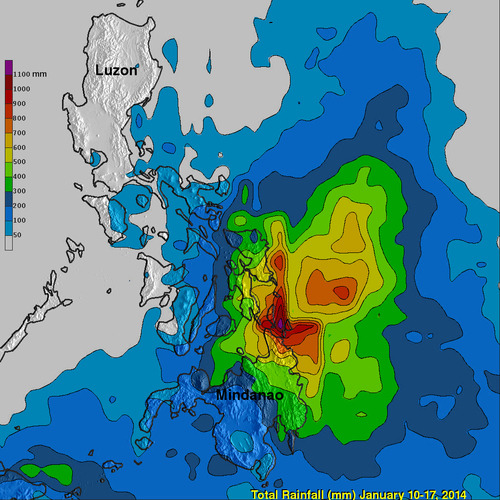
The bulk of the rain passed south of the areas ravaged by Haiyan, affecting the provinces of Suriago, Agusan, Leyte and various others. Rainfall rates between 10-50mm/h were observed on radar but in the strongest convective bands reached up to 140mm/h. Total accumulations for the week reached over 1200mm (1.2m) in the hardest hit areas of northern Mindanao where the average January rainfall is 370mm! Unfortunately with this extreme rainfall came flooding and landslides which contributed to 42 deaths and has displaced 129,000 people.


Total rainfall for Philippines between Jan. 10th and 17th, while Agaton was affecting the region (NASA-TRIMM image). (Source: NASA)

After making landfall Agaton slowly weakened and was downgraded to a low pressure system. This weekend it is no longer a threat to the Philippines.

Elsewhere in Weather News: November 29th, 2013

Flooding Affects Italy

Severe flooding has been taking place in Sardinia, Italy this past week causing residents to rush for higher ground. Sardinia is one of Italy’s islands located in the Mediterranean Sea; about 1.7 million Italians reside here. An upper level low drew in moist air from the Mediterranean Sea and spun just off the coast of Sardinia, causing for some significant flooding on the island. Rainfall totals generally ranged between 35 and 50mm on the island, which is over half of their monthly total for November.


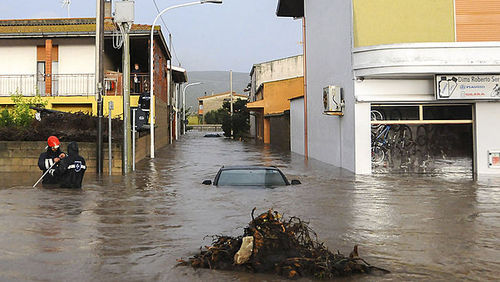
Severe flooding in the city of Uras, on the island of Sardinia. (Source: AP)

As this fell in a span of about 24 hours, sewers were unable to handle these large volumes of water in that short period of time. In some areas water levels reached about three meters, causing roads and bridges to be washed away. As of Friday night 18 fatalities had been reported. Several waterspouts and brief tornadoes had also been spawned by this system off of Italy’s coast and on the mainland.

Tornadoes Rip through US Midwest

In last week’s post of EIWN the risk for severe storms affecting the Midwest US had been briefly talked about. The event that occurred on Sunday was a fairly significant event; the moderate risk talked about in last week’s post had been upgraded to a high risk on Sunday – a risk only issued once or twice by the SPC when major severe weather events are imminent. This severe weather event followed up with all the hype ahead of it. In total, 106 tornado reports were received and 74 tornadoes were confirmed. Two of these were classified as EF-4 strength and 33 classified of EF-2 strength and higher, making November 17th a significant tornado outbreak in the Midwest. There were also numerous (400+) wind damage reports scattered from Iowa to New Jersey, as expected with the high shear environment on that day. One of the strongest tornadoes of the day – an EF-4 ripped through the town of Washington, Ill., where some houses were completely ripped apart by the twister. Death toll from the outbreak is at eight but could have been significantly higher if not for the good forecasting and swift warning issuance by NWS.


Map of all the warnings and watches issued on the 17th. Tornado watches/warnings in red and severe thunderstorm watches/warnings in blue. Polygons are the warnings. (Source: SPC)
Map of all the warnings and watches issued on the 17th. Tornado watches/warnings in red and severe thunderstorm watches/warnings in blue. Polygons are the warnings. Click on image to enlarge. (Source: SPC)